4.4 Income/Revenue Canvas
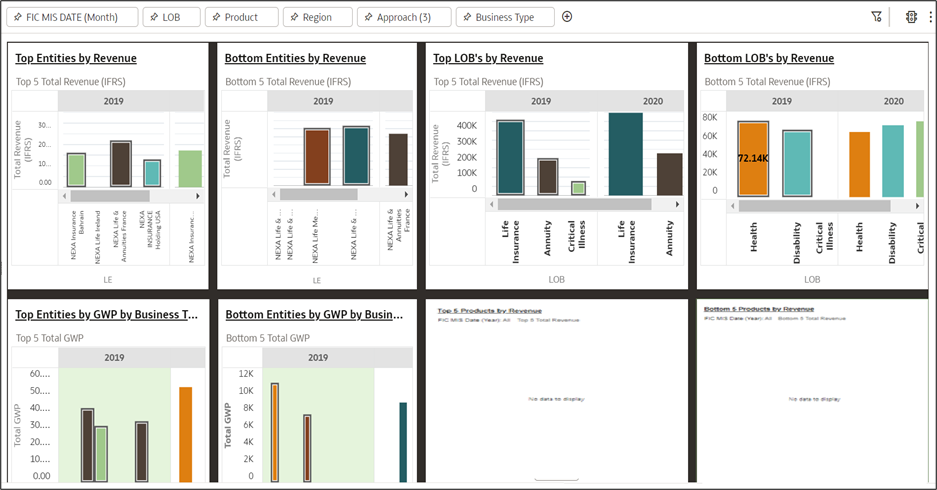
The Income/Revenue canvas contains Income for the company in terms through Gross Written Premium. The reports display rankings especially top and bottom, through legal entities, products, LOBs, Regions etc. Each of these analyses can be rendered and generated by selecting the Canvas Level filters and their combinations.
Figure 4-21 Income/Revenue Canvas
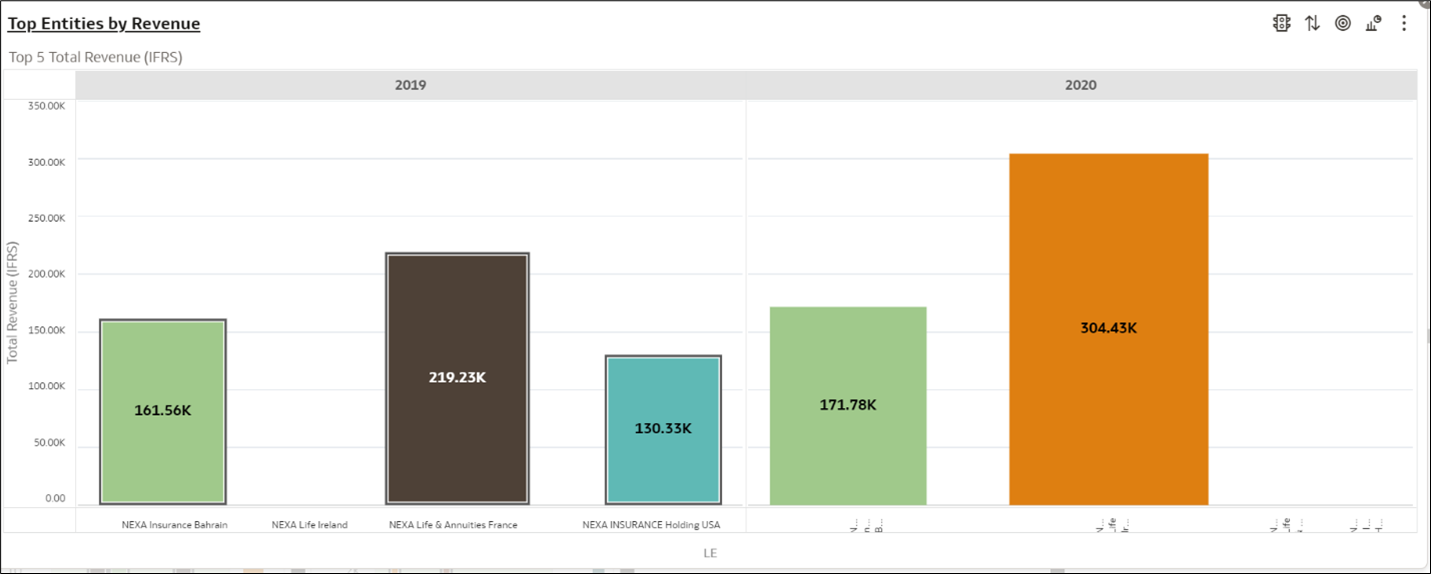
Top Entities by Revenue
Figure 4-22 Top Entities by Revenue
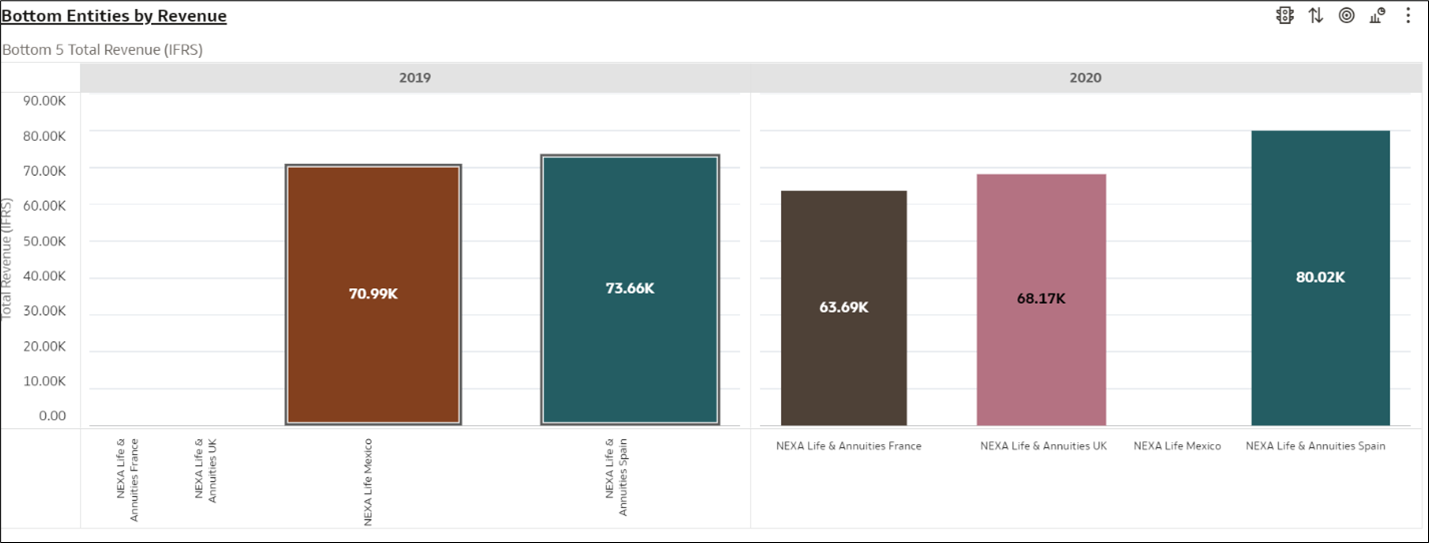
Bottom Entities by Revenue
Figure 4-23 Bottom Entities by Revenue
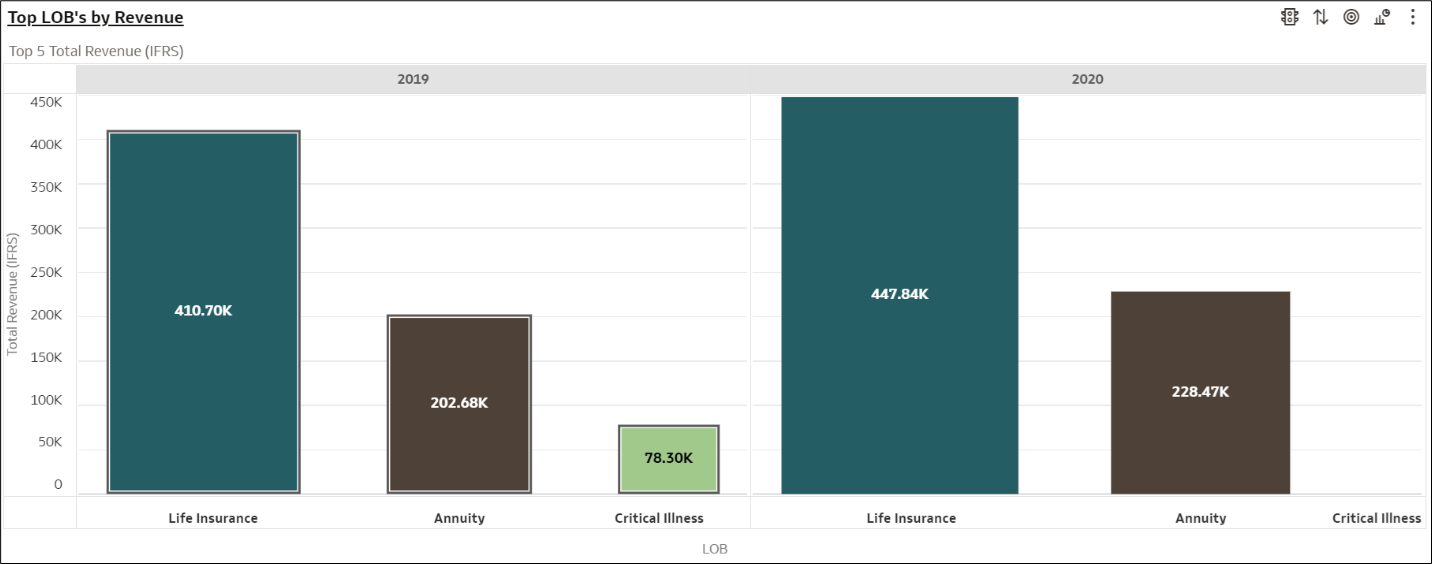
Top LOBs by Revenue
Figure 4-24 Top LOBs by Revenue
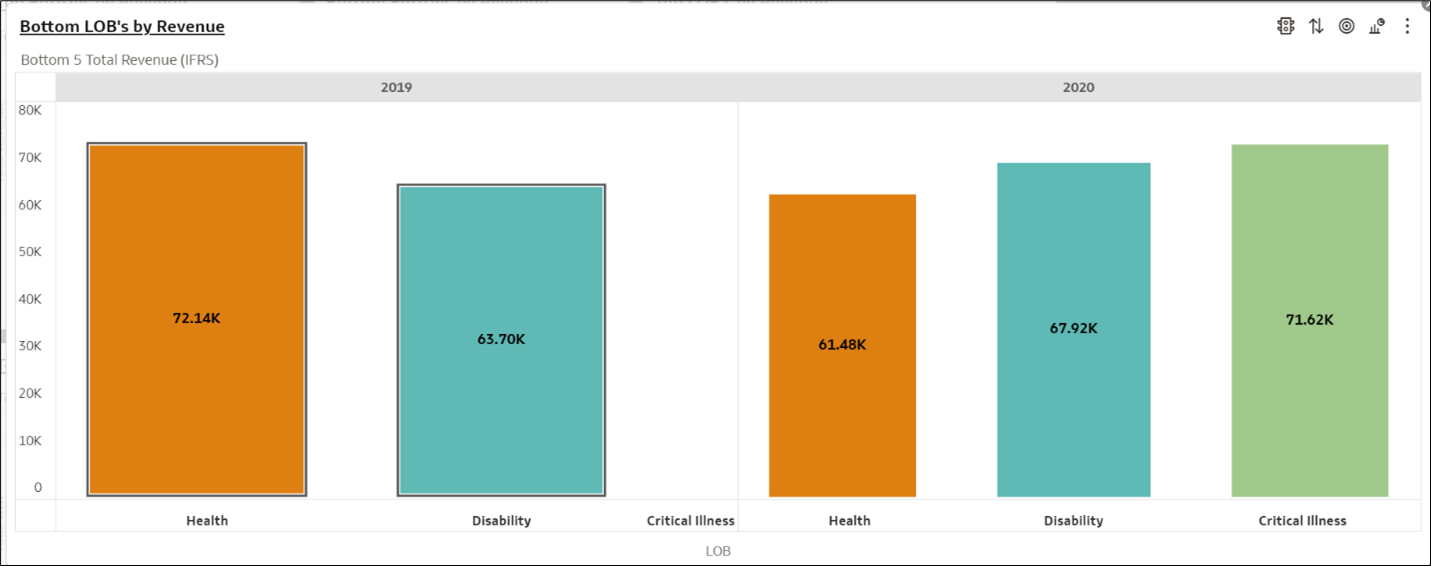
Bottom LOBs by Revenue
This ranking report displays revenue generated by least performing LOBs for the selected period. This report can be analyzed by selecting canvas level filters by Product, Region and new and existing business types.
Figure 4-25 Bottom LOBs by Revenue
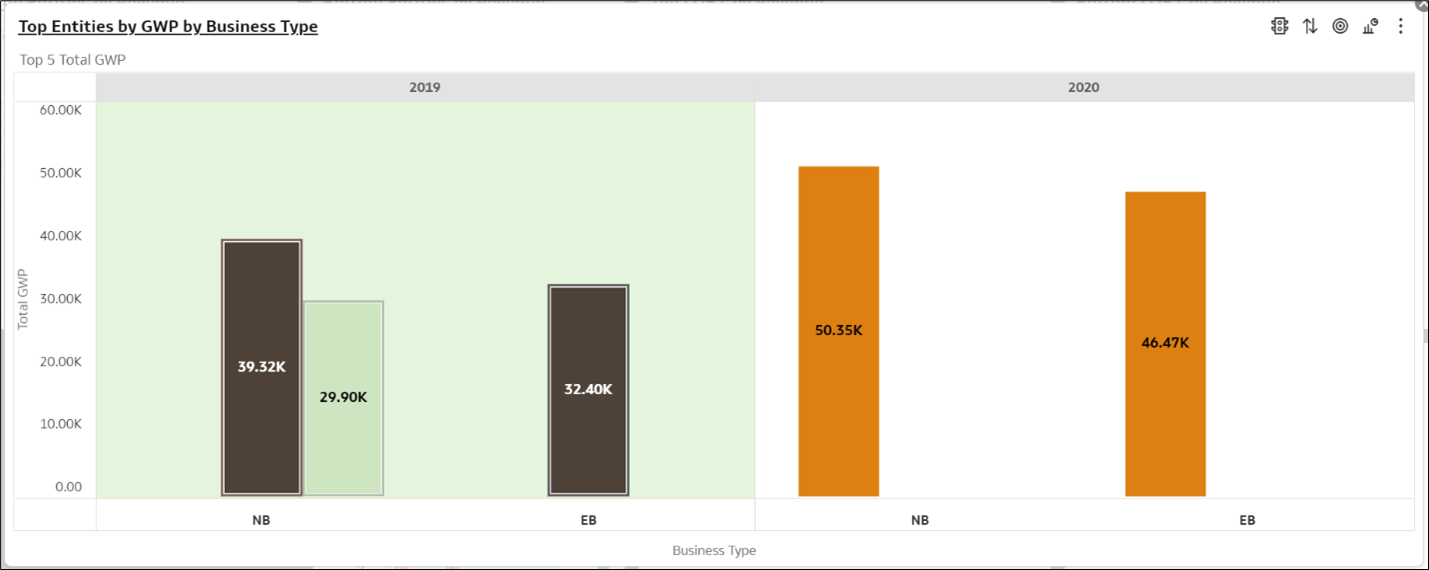
Top Entities by Revenue by Business Type
This ranking report displays revenue generated by best performing legal entities segregated by new and existing business for the selected period. This report can be analyzed by selecting canvas level filters by LOB, Product, Region and new and existing business types.
Figure 4-26 Top Entities by Revenue by Business Type
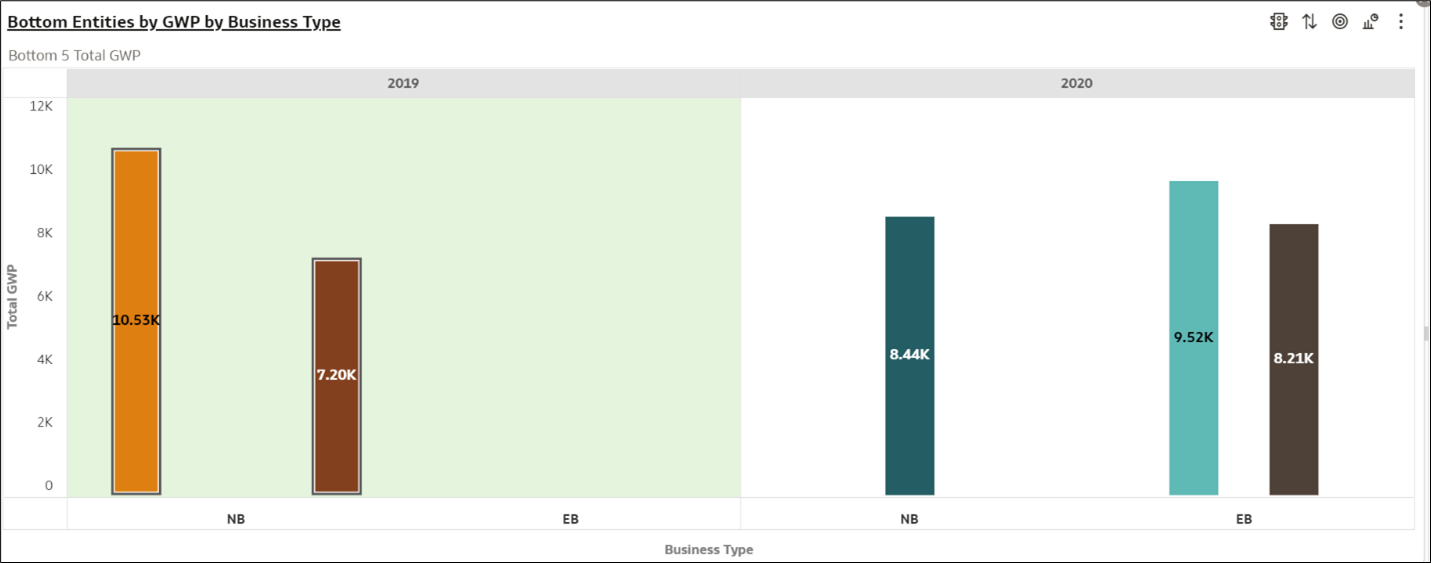
Bottom Entities by Revenue by Business Type
This ranking report displays revenue generated by least performing legal entities segregated by new and existing business for the selected period. This report can be analyzed by selecting canvas level filters by LOB, Product, Region and new and existing business types.
Figure 4-27 Bottom Entities by Revenue by Business Type
Top Products by Revenue
This ranking report displays revenue generated by best performing Products for the selected period. This report can be analyzed by selecting canvas level filters by region and new and existing business types.
Bottom Products by Revenue
This ranking report displays revenue generated by least performing Products for the selected period. This report can be analyzed by selecting canvas level filters by region and new and existing business types.