4.2 KPI Board Canvas
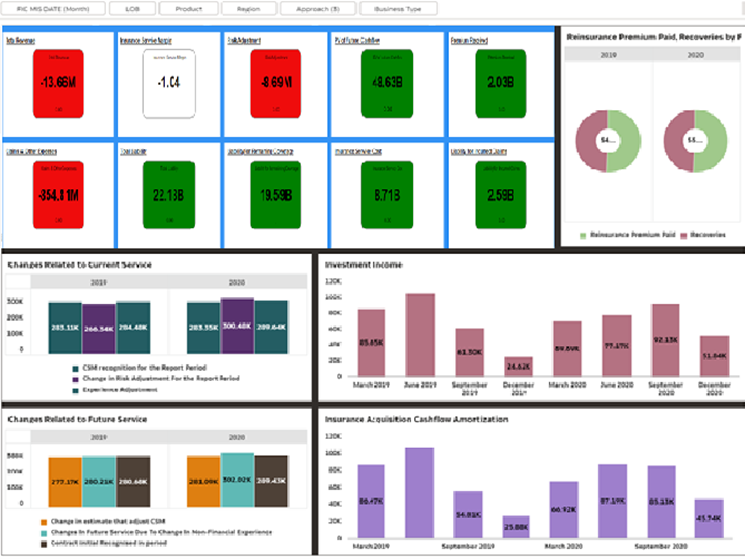
The KPI Board canvas contains reports snap shots of key performance indicators (KPI) for Business; The KPIs in this dashboard is a combination of flash boxes RAG Indicators and trends reports. Each of the KPI report can be rendered and generated by selecting the Canvas Level filters and their combinations.
Figure 4-8 KPI Board Canvas Reports
The KPI Board Canvas Contains following reports.
Key Performance Indicators Flash
Figure 4-9 KPI Flash boxes

Changes Related to Current Service
This report provides a trend analysis of changes or movements in insurance liabilities, during the coverage period of contracts under different methods/approaches. This report can be further analyzed by selecting canvas level drop down filter conditions.
Figure 4-10 Changes Related to Current Service

Changes Related to Future Service
This report provides a trend analysis of changes or movements in insurance liabilities, during the coverage period of contracts under different methods/approaches. This report can be further analyzed by selecting canvas level drop down filter conditions.
Figure 4-11 Changes Related to Future Service

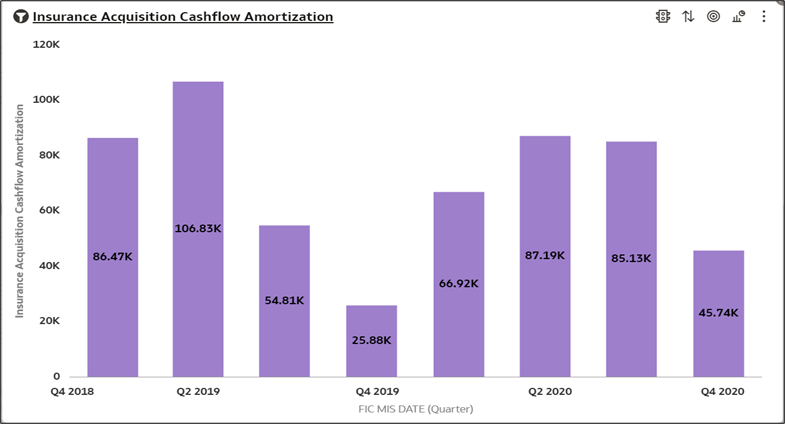
Insurance Acquisition Cashflow Amortization
This report provides a trend analysis of changes or movements in acquisition cashflow amortization, during the coverage period of contracts under different methods/approaches. This report can be further analyzed by selecting canvas level drop down filter conditions.
Figure 4-12 Insurance Acquisition Cashflow Amortization
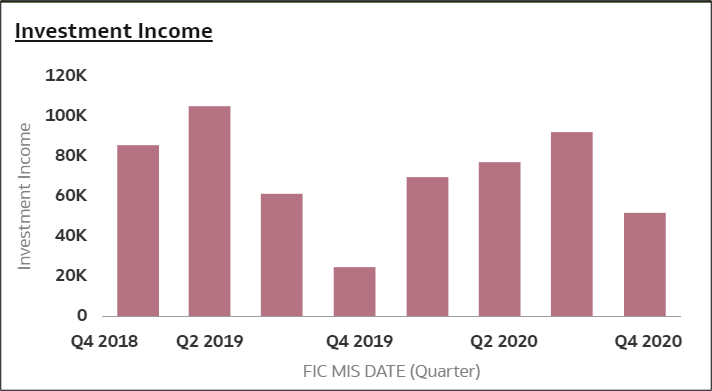
Investment Income
This report provides a trend analysis of changes or movements in Investment Income, during the coverage period of contracts under different methods/approaches. This report can be further analyzed by selecting canvas level drop down filter conditions.
Figure 4-13 Investment Income
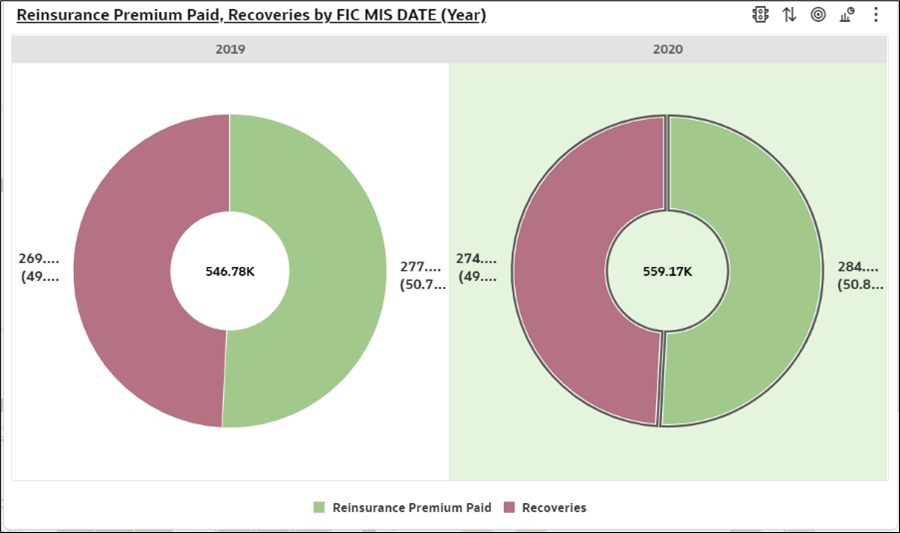
Reinsurance Premium Paid vs Recoveries
This Report shows comparative charts between reinsurance premium paid vis-à-vis reinsurance recoveries. This report can be further analyzed by selecting canvas level drop down filter conditions.
Figure 4-14 Reinsurance Premium Paid vs Recoveries
Net Income (Expense) from Reinsurance Contract
This Report shows net income or expenses from reinsurance contracts. This report can be further analyzed by selecting canvas level drop down filter conditions.
Figure 4-15 Net Income (Expense) from Reinsurance Contract
