4.5.2 Trend 2 Canvas
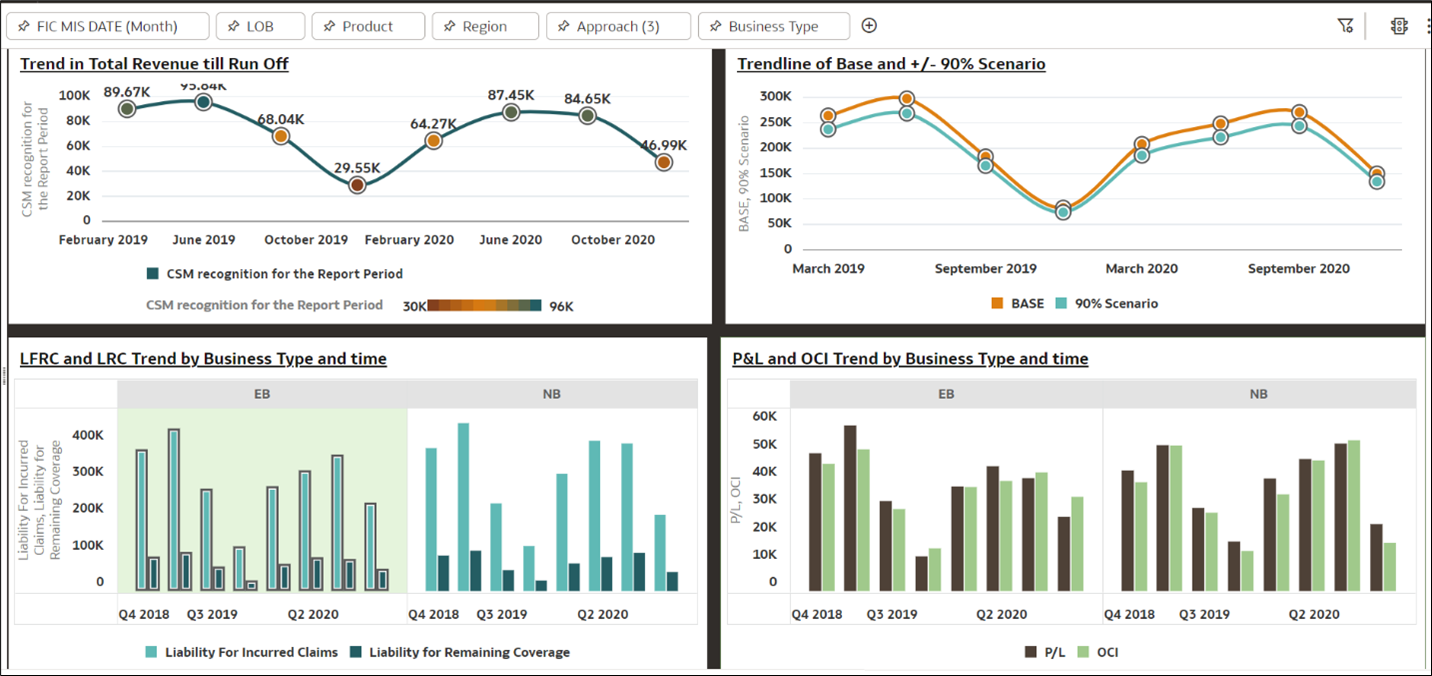
The Trend 2 Canvas contains specific time series analysis on total revenue trend, Scenario Analysis, Trend on P&L and OCI, LFRC and LRC by business type. It also does time series trend analysis on different scenarios like Base, Optimistic, Pessimistic and compares with 90% of scenarios taken together. Each of these analyses can be rendered and generated by selecting the Canvas Level filters and their combinations.
Figure 4-33 Trend 2 Canvas
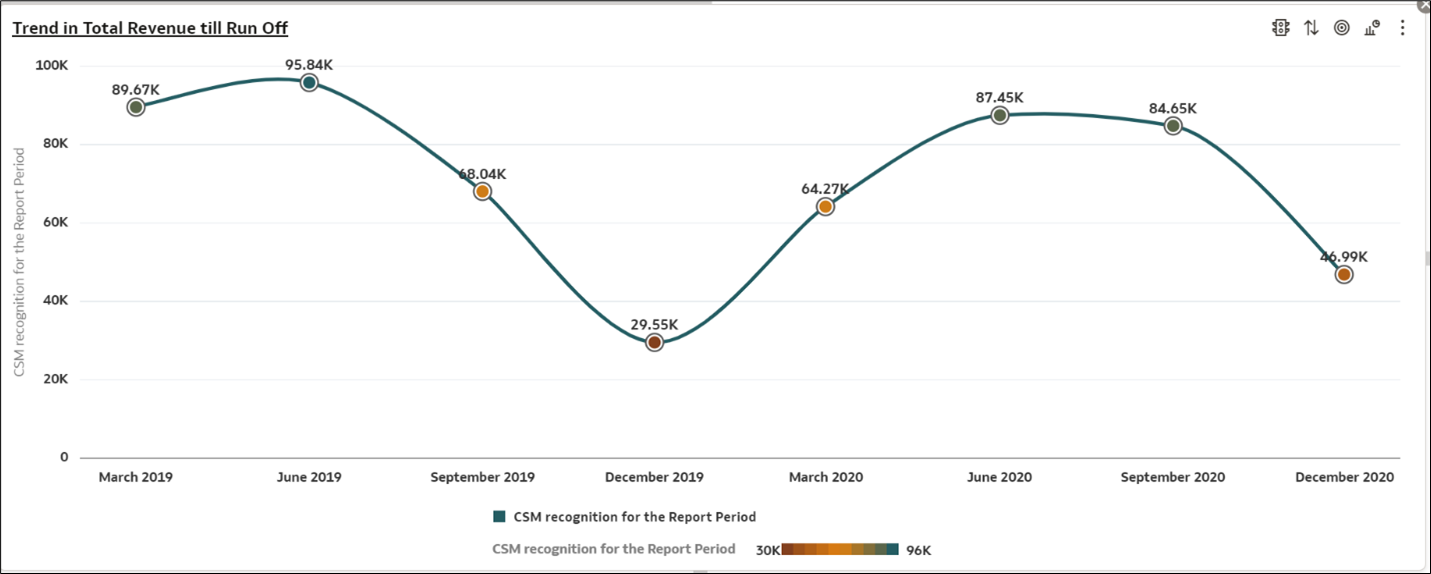
Trend in Total Revenue till Run-off
This Report captures time series analysis on Revenue Trend and CSM Recognition trend for the selected period. This report can be further analyzed by selecting canvas level filter combinations.
Figure 4-34 Trend in Total Revenue till Run-off
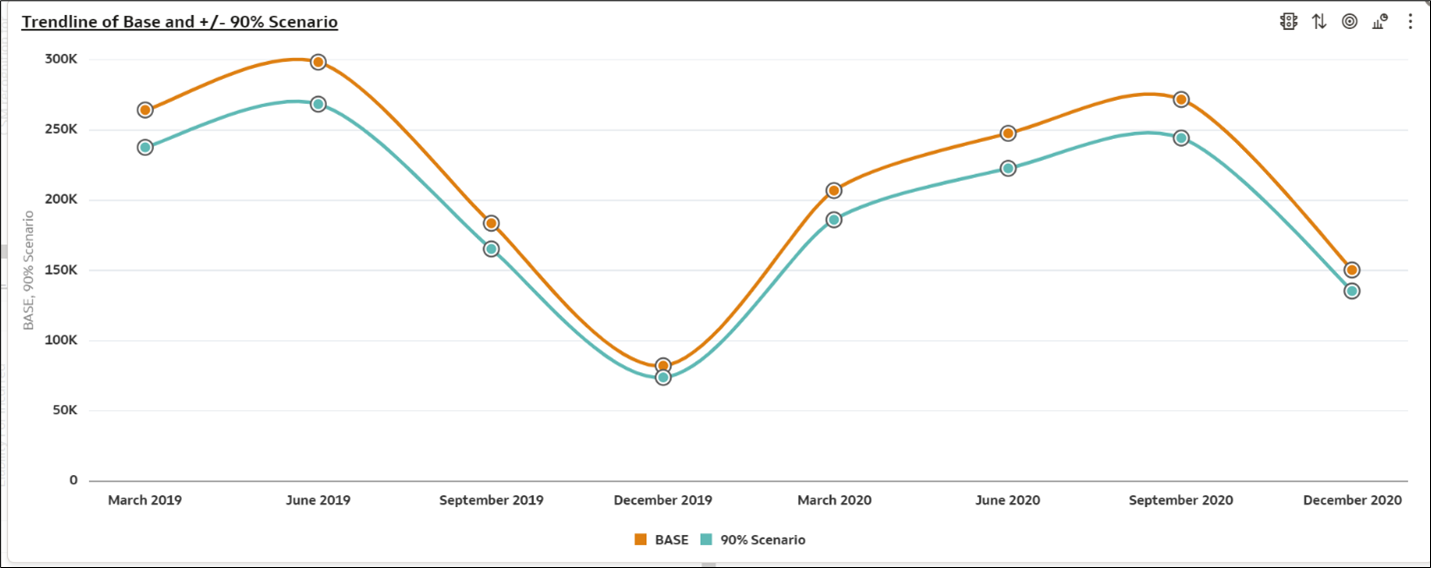
Trendline of Base and +/- 90% Scenario
This Report shows time series trend on scenarios at different levels like base and aggregate of scenarios (90%) for the selected period. This report can be further analyzed by selecting canvas level filter combinations.
Figure 4-35 Trendline of Base and +/- 90% Scenario
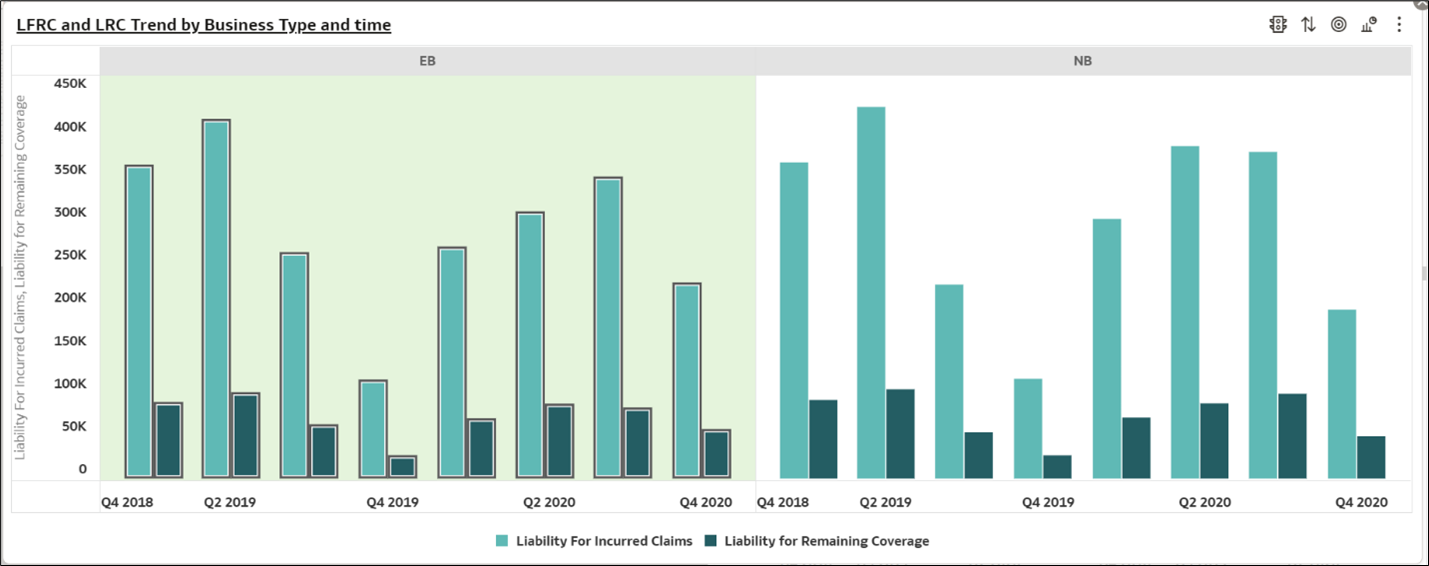
LFRC and LIC Trend by Business Type and Time
This Report shows time series trend on LFRC and LIC for the selected period. This report can be further analyzed by selecting canvas level filter combinations.
Figure 4-36 LFRC and LIC Trend by Business Type and Time
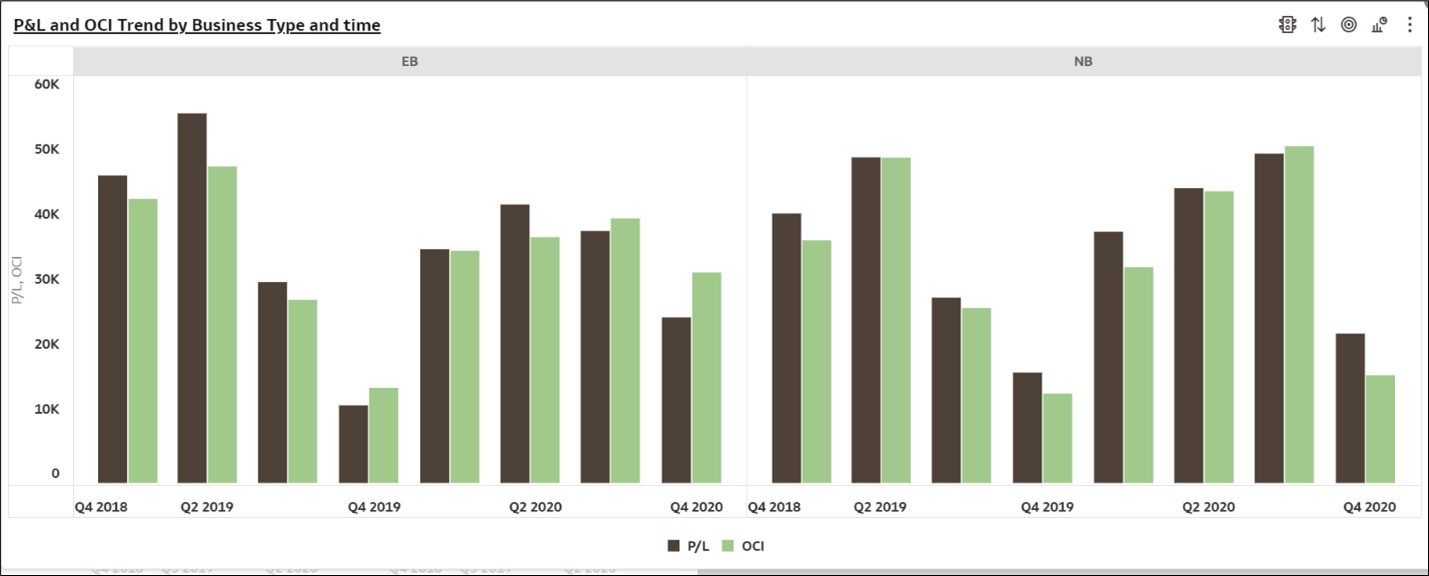
P&L and OCI Trend by Business Type and Time
This Report shows time series trend on P&L and Other comprehensive Income (OCI) for the selected period. This report can be further analyzed by selecting canvas level filter combinations.
Figure 4-37 P & L and OCI Trend by Business Type and Time
