5.4.5 Catastrophe Tab

The Catastrophe tab includes reports that focus on the Key Performance Indicators for declared Catastrophe. The filters for this tab allow the report results to be focused on selected combinations for comparison and targeted analysis.

The filters include:

  • Time
  • Company
  • Catastrophe
  • Geography

The various reports available under this tab are detailed in the following sections.

Catastrophe Net Losses Map

This report is a Geographic Heat Map that illustrates the monetary amount of Net Losses, that is, Paid Losses exclusive of Expenses, for Catastrophe Claims over geographic regions with areas of similar amounts colored similarly. The Location of Loss provides the basis for geographical mapping.

Figure 5-231 Catastrophe Net Losses Map


Catastrophe Net Losses Map

Catastrophe Claim Ranking

An assessment and ranking of catastrophe losses can be measured by various performance measures like net losses, claim payments, and through the number of claims across regions and catastrophes. This report contains both tabular and geographical map that lists the catastrophe in the order of greatest value to the least value based on the grade basis selected.

Figure 5-232 Catastrophe Claim Ranking
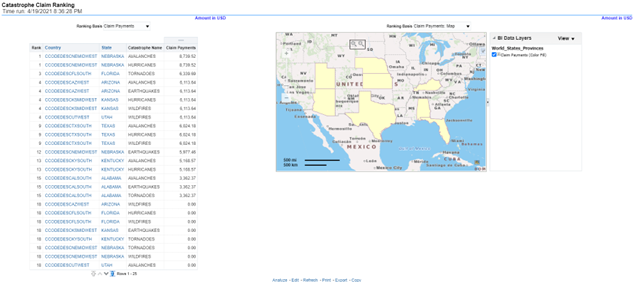

Catastrophe Claim Ranking

Catastrophe Lines of Business Impact

This is a tabular report that provides a summary of the effects of a catastrophe on the claim performance for the lines of business. The total claim payments, net losses, and claim count are presented for each Line of business for each catastrophic event.

Figure 5-233 Catastrophe Lines of Business Impact
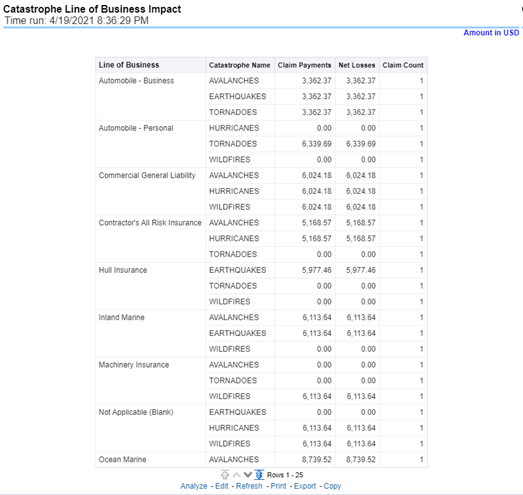

Catastrophe Lines of Business Impact

Catastrophe Product Impact

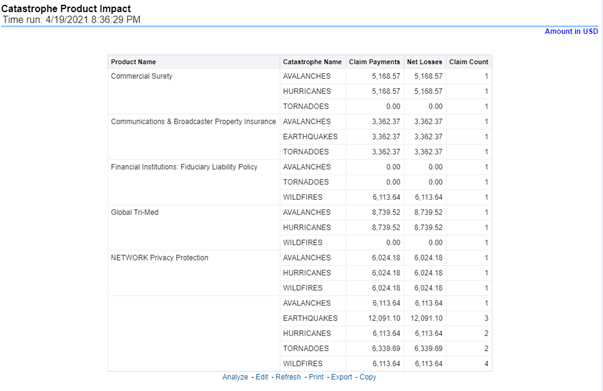
This is a tabular report that provides a summary of the effects of a catastrophe on the claim performance of the product. The total claim payments, net losses, and claim count are presented for each Line of business for each catastrophic event.

Figure 5-234 Catastrophe Product Impact

Catastrophe Product Impact

Catastrophe Overview

This is a tabular report that summarizes the key performance factors for Claims performance for each Catastrophe.

Figure 5-235 Catastrophe Overview


Catastrophe Overview

Catastrophe Claim Payments by Loss Type
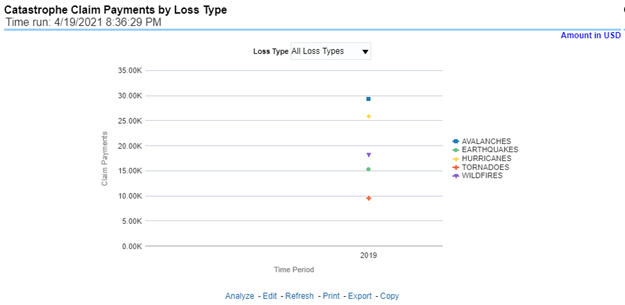
This report is a line graph that displays the monetary amount of payments that have been made for losses reported for each catastrophe. The loss types can be further filtered to see the specific loss type details. Each catastrophe is represented by its own line.

Figure 5-236 Catastrophe Claim Payments by Loss Type


Catastrophe Claim Payments by Loss Type

Catastrophe Payments by Reinsurance Company
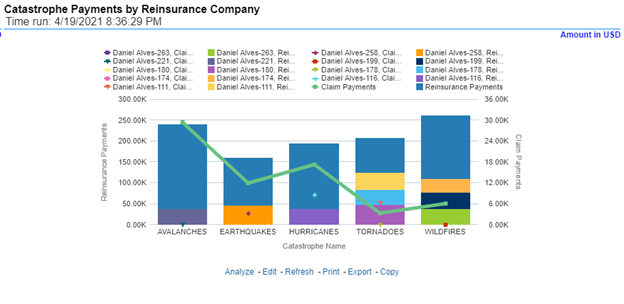
This report is a bar/line graph that illustrates the relationship between the amount of payments made by the insurer and those that were received by the reinsurers for each Catastrophe.

Figure 5-237 Catastrophe Payments by Reinsurance Company


Catastrophe Payments by Reinsurance Company

Catastrophe Expenses by Loss Type

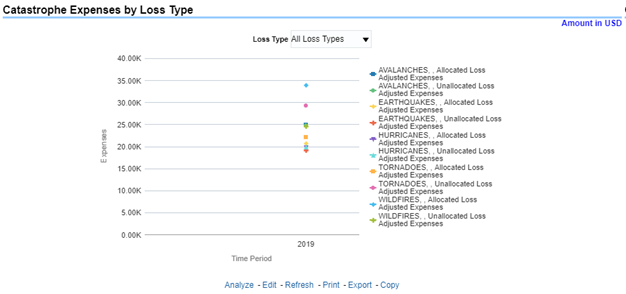
This report is a line graph that illustrates the monetary payment totals generated for Expenses on claims based on the cause of the loss. Each Expense amount is categorized by the Catastrophe and type of Loss. Additional Details can be reviewed by selecting a specific Loss Type from the Loss Type selection field.

Figure 5-238 Catastrophe Expenses by Loss Type

Catastrophe Expenses by Loss Type

Catastrophe Expenses by Expense Type

This report is a line graph that illustrates the monetary payment totals generated for expenses on claims based on the categorization of the expense. Each expense amount is categorized by the catastrophe and type of expense. Additional details can be reviewed by a specific expense type from the expense type selection field.

Figure 5-239 Catastrophe Expenses by Expense Type
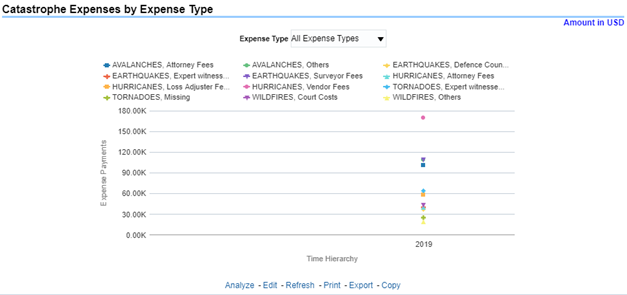

Catastrophe Expenses by Expense Type

Catastrophe Recovery Overview by Catastrophe
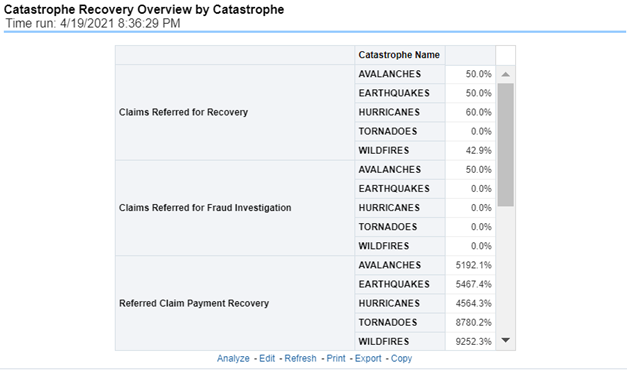
This report is a tabular representation illustrating the performance of Recovery Referral for each Catastrophe and the performance of those efforts.

Figure 5-240 Catastrophe Recovery Overview by Catastrophe


Catastrophe Recovery Overview by Catastrophe

Catastrophe Recovery Payments

This report is a line graph that illustrates the total monetary amount of Recovery Payments, payments received by an insurer that reimburses it for losses it paid, received for Catastrophe Claims during a reporting period and shown over a period for each Catastrophe. Each Catastrophe is represented by its own line.

Figure 5-241 Catastrophe Recovery Payments
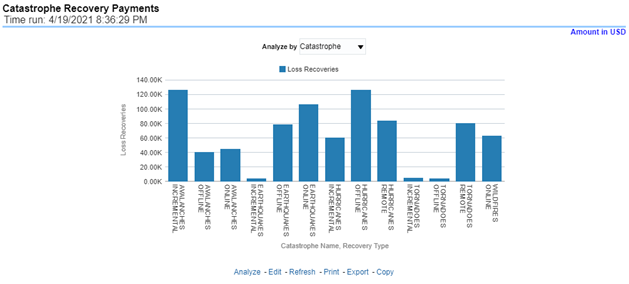

Catastrophe Recovery Payments

Average Days until Closed

This report is a line graph that illustrates the average number of days between the day a catastrophe claim is opened in the system and the date that the status of the same claim is changed to "Closed". This average is shown over a time series for each catastrophe.

Figure 5-242 Average Days until Closed
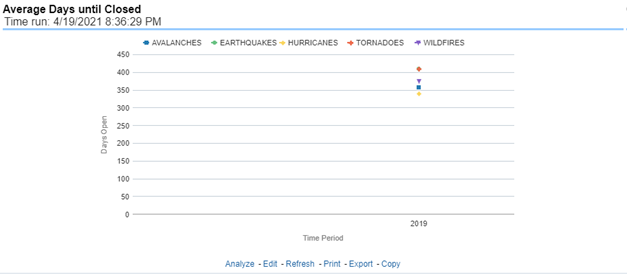

Average Days until Closed

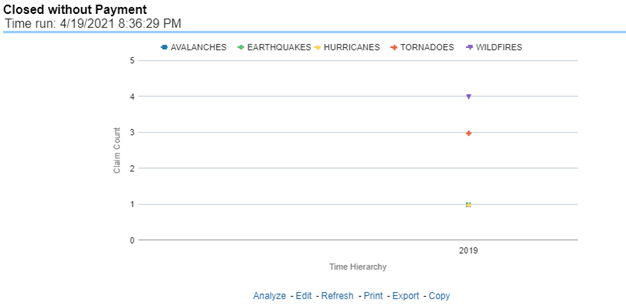
Closed Without Payment

This report displays the count of catastrophe claims that were closed without any payments for losses being issued to claimants. The graph shows the average count of days for these claims per catastrophe over time.

Figure 5-243 Closed Without Payment


Closed Without Payment

Claims Closed Due to Fraud

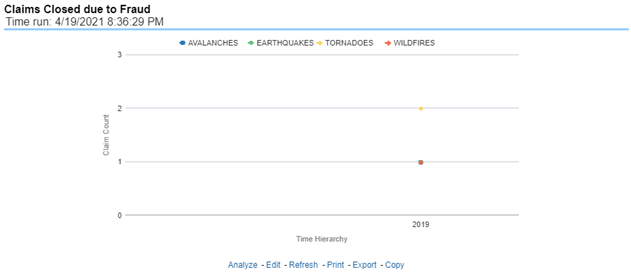
This report is a line graph that displays the count of catastrophe claims that were closed after an investigation determined that fraudulent activity occurred and no losses were paid to the claimant due to the fraud activity. The graph shows the count of these claims per catastrophe over time.

Figure 5-244 Claims Closed Due to Fraud

Claims Closed Due to Fraud

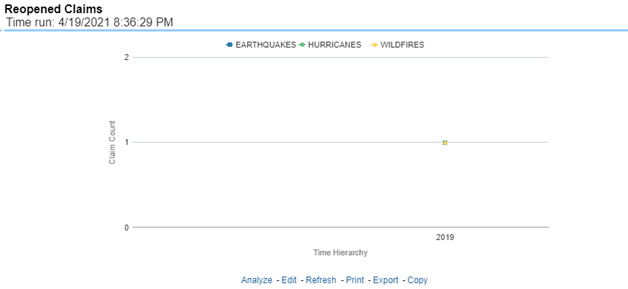
Reopened Claims

This report displays the count of catastrophe claims that were initially closed and then opened again for further processing. This shows the count of claims per catastrophe where this process occurred over time.

Figure 5-245 Reopened Claims


Reopened Claims

Litigation Claims

This report is a line graph that displays the count of catastrophe claims that resulted in a judicial litigation case being initiated. This shows the count of claims per catastrophe where this process occurred over time.

Figure 5-246 Litigation Claims


Litigation Claims