5.3.6 Producer Tab
The Producer Performance tab focuses on the results of the Producing Agents and Producing Agencies. The filters for this tab allow the report results to be focused on selected combinations for comparison or more targeted analysis.
The filters include:
- Time
- Company
- Geography
- Lines of Business
- Product
- Producer
The various reports available for this tab are discussed in the following sections.
New Business
Figure 5-168 New Business

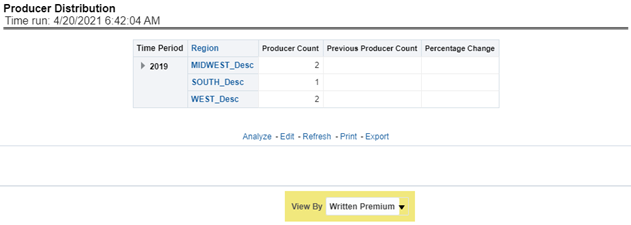
Producer Distribution
Figure 5-169 Producer Distribution
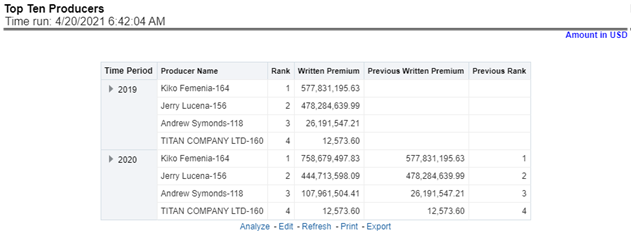
Top Ten Producers
This is a tabular report where the top-performing producers are ranked through business measures generated by each of them in comparison with the previous period business measures and previous rank. This report also records the upward and downward movement of the producer's rank compared between current and previous ranking. This ranking can be viewed by the following business measures and each of these options can be selected from report level drop-down filters.
- Written Premium
- Bind Ratio
- Policy Count
- Attrition Ratio
- Claim Count
- Loss Ratio
- Loss Payments
Figure 5-170 Top Ten Producers
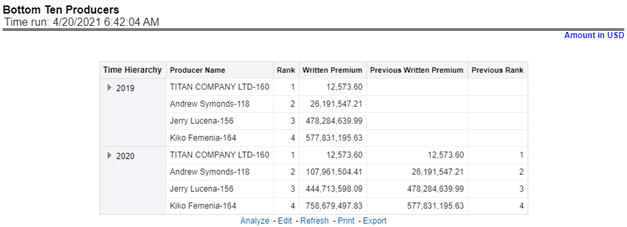
Bottom Ten Producers
This is a tabular report where the least performing producers are ranked through business measures generated by each of them in comparison with the previous period business measures and previous rank. This report also records the upward and downward movement of the producer's rank compared between current and previous ranking. This ranking can be viewed by the following business measures and each of these options can be selected from report level drop-down filters.
- Written Premium
- Bind Ratio
- Policy Count
- Attrition Ratio
- Claim Count
- Loss Ratio
- Loss Payments
Figure 5-171 Bottom Ten Producers
Active Producer Appointments
Figure 5-172 Active Producer Appointments

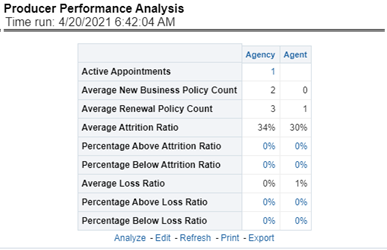
Producer Performance Analysis
This tabular report shows the producers' performance through the following performance measures.
- Average New Business Policy Count
- Average Renewal Policy Count
- Average Attrition Ratio
- Percentage Above Average Attrition Ratio
- Percentage Below Average Attrition Ratio
- Average Loss Ratio
- Percentage Above Average Loss Ratio
- Percentage Below Average Loss Ratio
Figure 5-173 Producer Performance Analysis
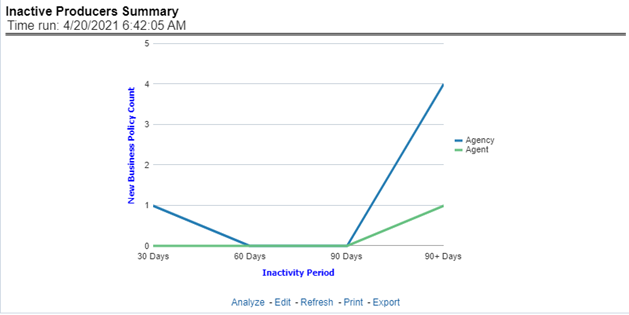
Inactive Producer Summary
Figure 5-174 Inactive Producer Summary
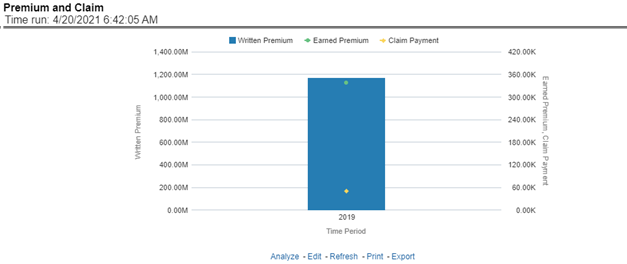
Premium and Claim
Figure 5-175 Premium and Claim
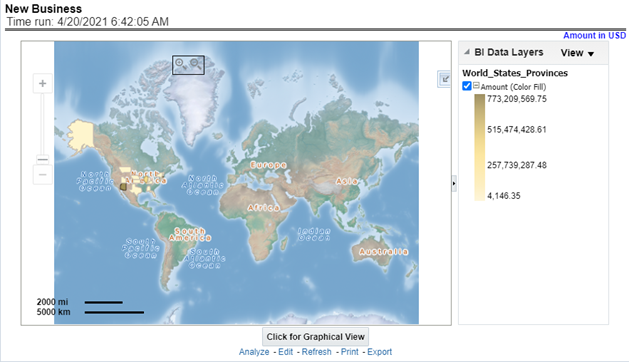
New Business
This is a map report where New Business volume is measured across regions. This report can be viewed over various periods, company, geography, product, and lines of business selected from page-level prompts.
Figure 5-176 New Business
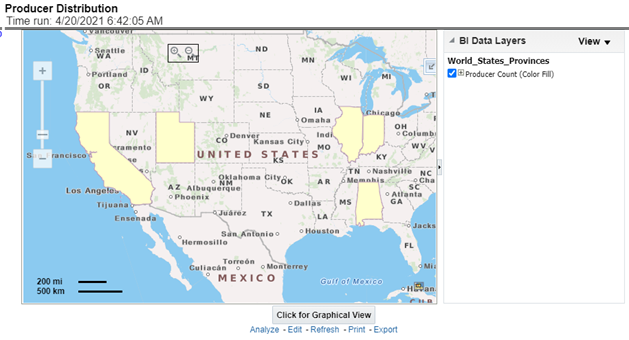
Producer Distribution
This is a map report where Producer Distribution is measured across regions. This report can be viewed over various periods, company, geography, product, and lines of business selected from page-level prompts.
Figure 5-177 Producer Distribution
Active Producer Appointments
This is a map report where the active producer availability by appointment status (Active Status) is measured across regions. This report can be viewed over various periods, company, geography, product, and lines of business selected from page-level prompts.
Figure 5-178 Active Producer Appointments
