All reports on this tab focus on the policy performance perspective. The
reports represent business performance through a policy performance perspective.
The filters of this tab include:
The various reports available under this tab are discussed in the following sections.
Customer and Policy
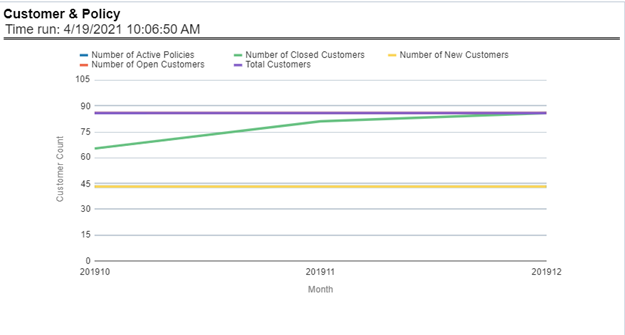
This report provides enterprise-wide performance with customer and policy information
overtime a period. Various performance metrics-based measures, for example, the
number of New Customers, Number of Closed Customers, and so on for the reporting
period selected, are compared with the previous periods and displayed. It shows
enterprise performance through customers and policies. This report can be viewed and
tracked through control areas like Time, Company, and Geography. The values are in
the Line Graph.
Income Statement
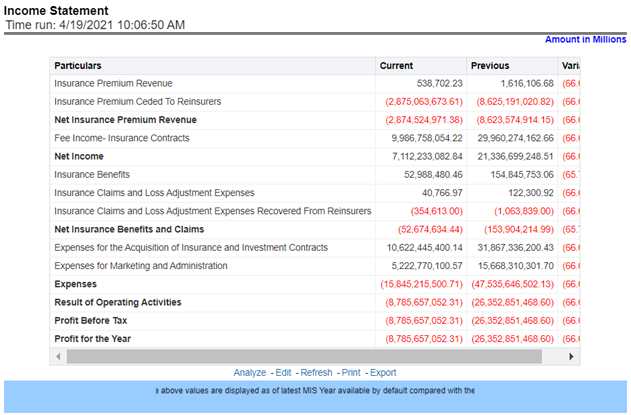
At an enterprise level, performance through various financial indicators can be
tracked through an Income Statement. This helps to understand the company's
financial position at a given point in time. This report can be analyzed over
various periods, entities, and geographies selected from page-level prompts. The
values are in a table.
Policy
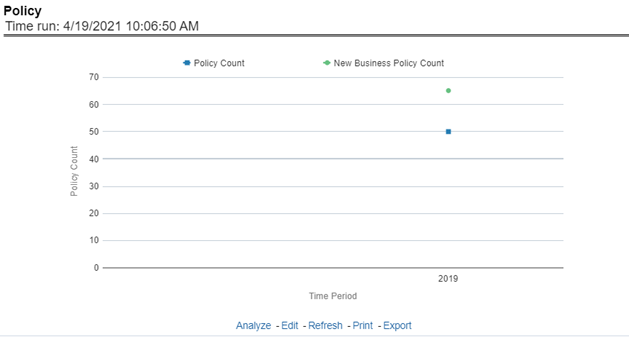
This report shows counts of policies for all lines of businesses and underlying
products through a time series. This report can be analyzed over various periods,
entities, and geographies selected from page-level prompts.
Premium Trends
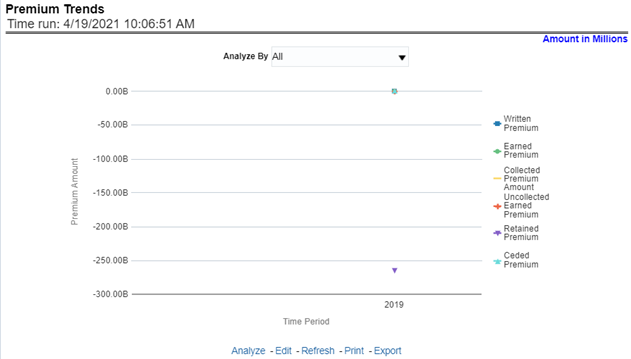
This report shows a trend in revenue through different types of premium, for example,
Written Premium, Earned Premium, and Ceded Premium, at an enterprise level, for all
lines of businesses and underlying products through a time series. The Premium
Trends report contains the following report level filters:
- Written Premium
- Earned Premium
- Collected Premium
- Uncollected Earned Premium
- Retained Premium
- Ceded Premium
This report can be viewed by individual premium type or all types together through a
line graph. This report can be analyzed over various periods, entities, and
geographies selected from page-level prompts.
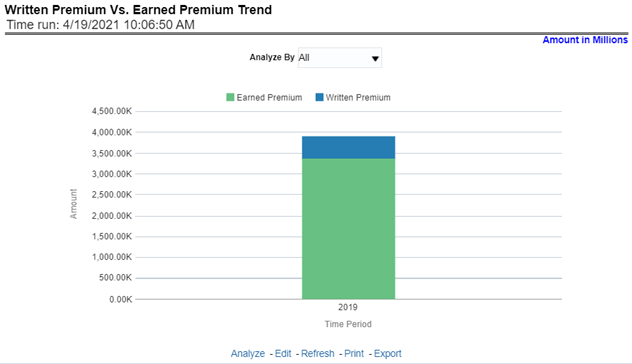
Written Premium versus Earned Premium Trend
This report shows the trend in revenue and a comparison between Written Premium and
Earned Premium, at an enterprise level, for all lines of businesses and underlying
products through a time series. This Trend can further be viewed and analyzed
through report level filters like Lines of business and Products for more
granularities, through a stacked bar graph. This report can be analyzed over various
periods, entities, and geographies selected from page-level prompts.
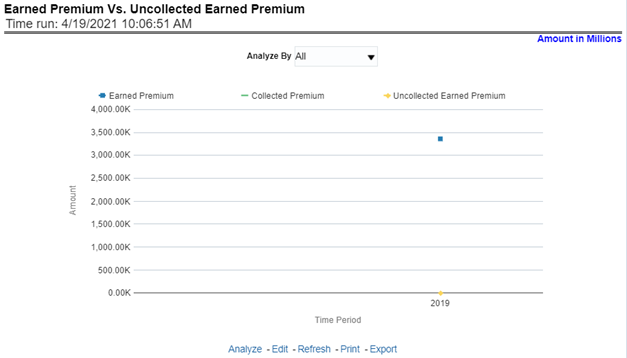
Earned Premium versus Uncollected Earned Premium
This report shows a trend in the actual collection of earned premium through a
comparison between earned premium, collected premium, and uncollected earned
premium. This report shows at an enterprise level, for all lines of businesses and
underlying products through a time series. This Trend can further be viewed and
analyzed through report level filters like Lines of business and Products for more
granularities. The values are in a stacked bar graph. This report can be analyzed
over various periods, entities, and geographies selected from page-level
prompts.
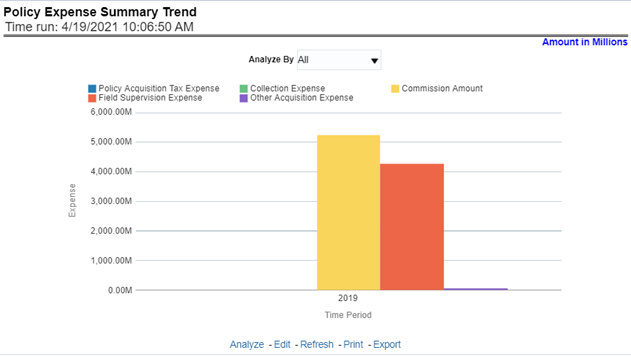
Policy Expense Summary Trend
This report shows policy-related expenses under different expense heads at an
enterprise level, for all lines of businesses and underlying products through a time
series. This Trend can further be viewed and analyzed through report level filters
like Lines of business and Products for more granularities. The values are in a
clustered bar graph. This report can be analyzed over various periods, entities, and
geographies selected from page-level prompts.
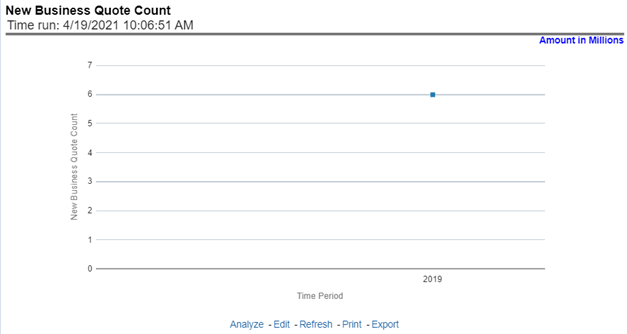
New Business Quote Count
This report shows the number of quotes generated for new business, at an enterprise
level, for all lines of businesses and underlying products through a time series.
This report can be analyzed over various periods, entities, and geographies selected
from page-level prompts.
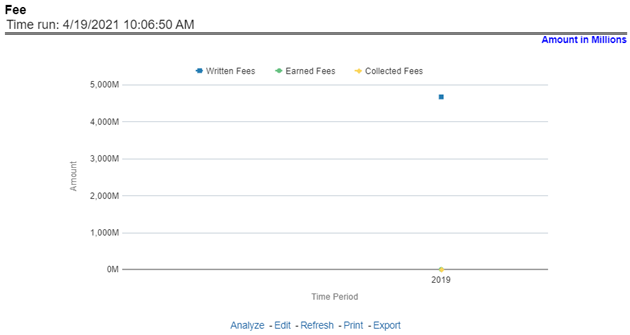
Fee
This report shows fee income generated, earned, collected, and refunded, at an
enterprise level, for all lines of businesses and underlying products through a time
series. This report can be analyzed over various periods, entities, and geographies
selected from page-level prompts.
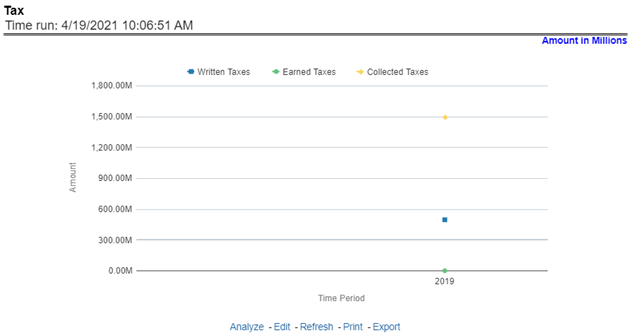
Tax
This report shows the premium tax trend for tax generated, earned, and collected, at
an enterprise level, for all lines of businesses and underlying products through a
time series. This report can be analyzed over various periods, entities, and
geographies selected from page-level prompts.
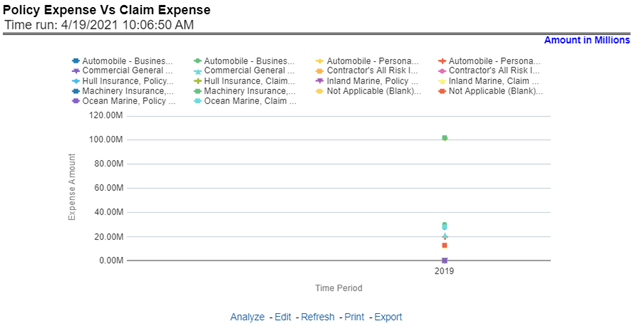
Policy Expense versus Claim Expense
This trend report shows a comparison between policy expenses and claim expenses, at
an enterprise level, for all lines of businesses and underlying products through a
time series. This report can be analyzed over various periods, entities, and
geographies selected from page-level prompts.
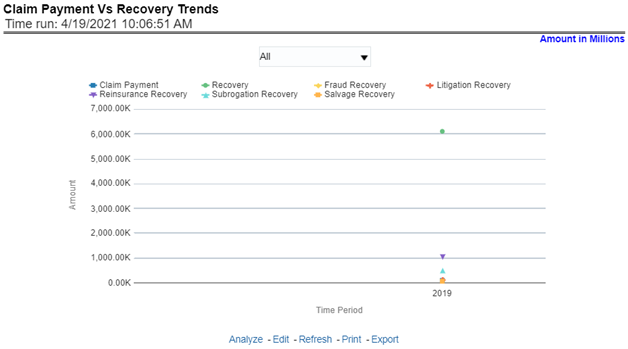
Claim Payment versus Recovery Trends
This report shows a comparison between claim payments and recoveries made as well as
the trend in various types of recoveries at an enterprise level, for all lines of
businesses and underlying products through a time series. This Trend can further be
viewed and analyzed through the following report level filters for more
granularities:
- Claim Payments
- All recovery Payments
- Fraud Recovery
- Litigation Recovery
- Reinsurance Recovery
- Subrogation Recovery
- Salvage Recovery
The values are in a line graph. This report can also be analyzed over various
periods, entities, and geographies selected from page-level prompts.
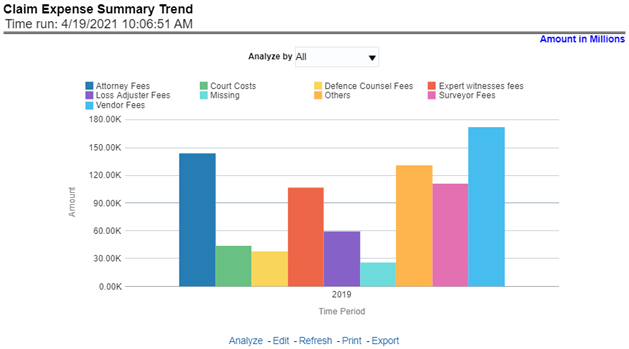
Claim Expense Summary Trend
This report shows a trend and comparison between various types of claim expenses at
an enterprise level, for all lines of businesses and underlying products through a
time series. This Trend can further be viewed and analyzed through the report level
filters, Lines of business and products, for more granularities. The values are in a
clustered bar graph. This report can also be analyzed over various periods,
entities, and geographies selected from page-level prompts.
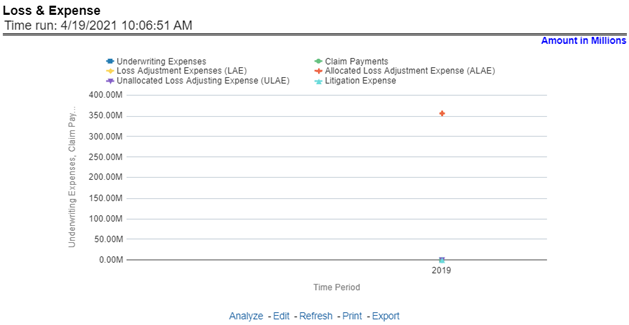
Loss and Expense
This report shows a trend and comparison between underwriting expense and various
types of loss adjustment expenses along with actual claim payments and litigation
expenses at an enterprise level, for all lines of businesses and underlying products
through a time series. The values are in a line graph. This report can also be
analyzed over various periods, entities, and geographies selected from page-level
prompts.
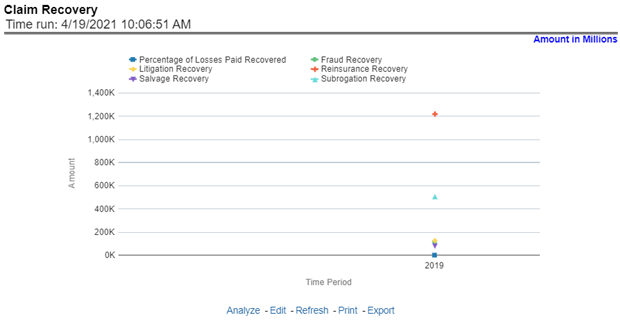
Claim Recovery
This report shows a trend in various types of recoveries as well as the extent of
recoveries against paid losses, at an enterprise level, for all lines of businesses
and underlying products through a time series. The values are in a line graph. This
report can also be analyzed over various periods, entities, and geographies selected
from page-level prompts.
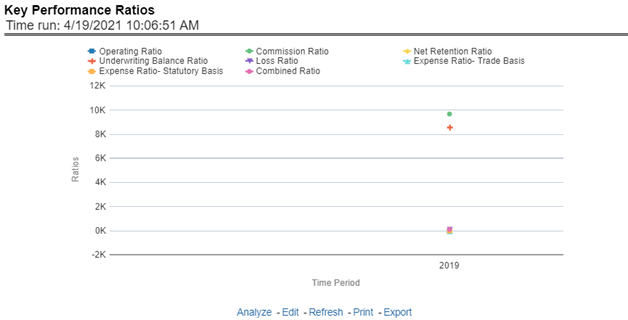
Key Performance Ratios
This report shows the trend in various key performance metrics, that is, combined
ratio, operating ratio, commission ratio, loss ratio, and so on for all lines of
businesses and underlying products over a selected period. Values are in a line
graph. This report can also be analyzed over various periods, entities, and
geographies selected from page-level prompts.
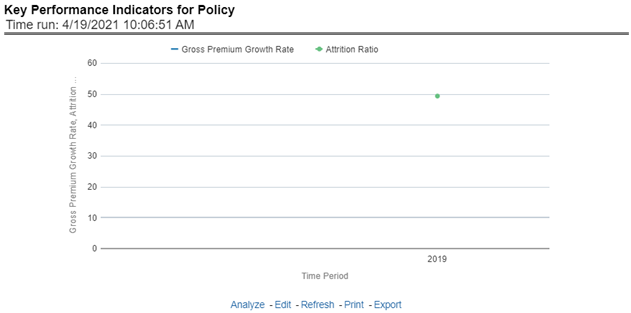
Key Performance Indicators for Policy
This report shows the trend in two key policy performance indicators that is the
gross premium growth rate and attrition ratio, for all lines of businesses and
underlying products through a time series. The values are in a line graph. This
report can also be analyzed over various periods, entities, and geographies selected
from page-level prompts.
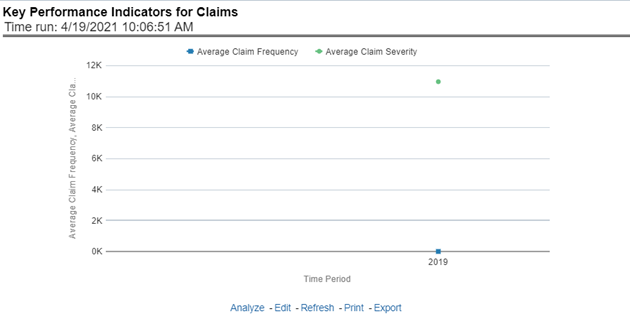
Key Performance Indicators for Claims
This report shows a trend in two key claim performance indicators, average values of
claim frequency and claim severity, for all lines of businesses, and underlying
products through a time series. The values are in a line graph. This report can also
be analyzed over various periods, entities, and geographies selected from page-level
prompts.
