6.4.3 Region Tab
The Region tab under the producer dashboard includes reports represented in tabular and map format that summarizes results for geographical regions. The filters for this tab allow the report results to be focused on selected combinations for geographical comparison.
The filters include:
- Time
- Company
- Lines of Business
- Product
- Producer
- Region
- Analyze by Producer Type- Agent, Agency
The various reports available for this tab are discussed in the following sections.
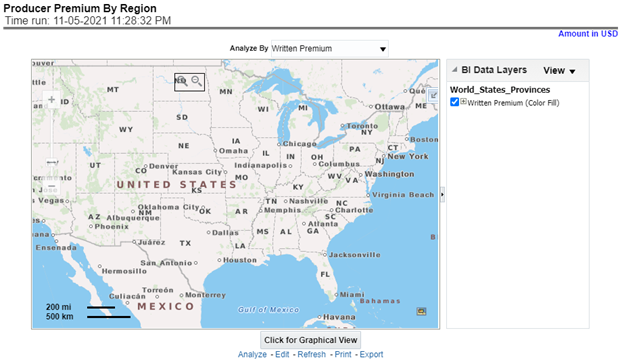
Producer Premium By Region
This map report shows different types of premium revenue generated by producers in various geographical regions. This report can be viewed over various combinations selected from the page-level prompts. This report can be analyzed by agents and agencies. This report shows different types of premium phases as given below:
- Written premium
- Earned premium
- Ceded premium
- Retained premium
- Refund premium
- Uncollected earned premiums
Figure 6-213 Producer Premium By Region
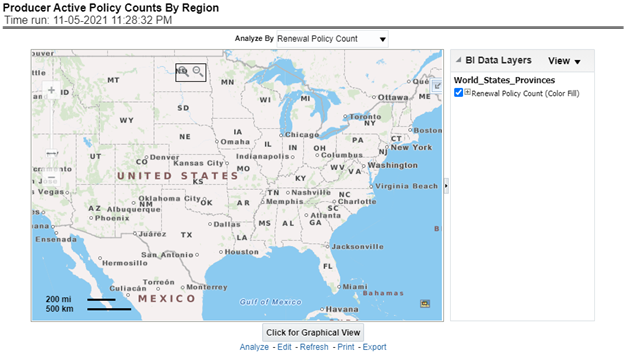
Producer Active Policy Counts By Region
This report shows a count of policies written by different policy types, that is, total policy count, new business policy count, and renewal policy count by producers. This report can be viewed over various periods, company, Region, product, and lines of business selected from the page-level prompts. This report can be analyzed by agents and agencies.
Figure 6-214 Producer Active Policy Counts By Region
Producer Ratios By Region
This report shows key indicator ratios like expense ratio, claim ratio and claim settlement ratio, premium collection ratio in different regions for the business generated by producers. This report can be viewed over various periods, company, Region, product, and lines of business selected from page-level prompts. This report can be analyzed by agents and agencies.
Figure 6-215 Producer Ratios By Region

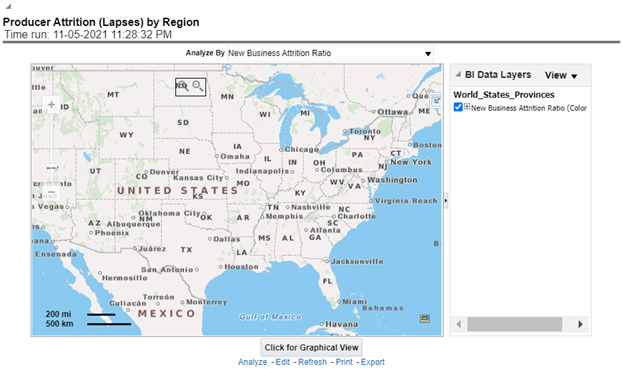
Producer Attrition (Lapses) by Region
Figure 6-216 Producer Attrition (Lapses) by Region
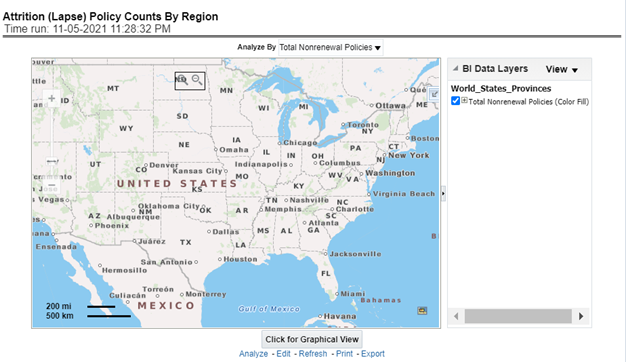
Producer Attrition (Lapse) Policy Counts by Region
Figure 6-217 Producer Attrition (Lapse) Policy Counts by Region
Claim Status by Region
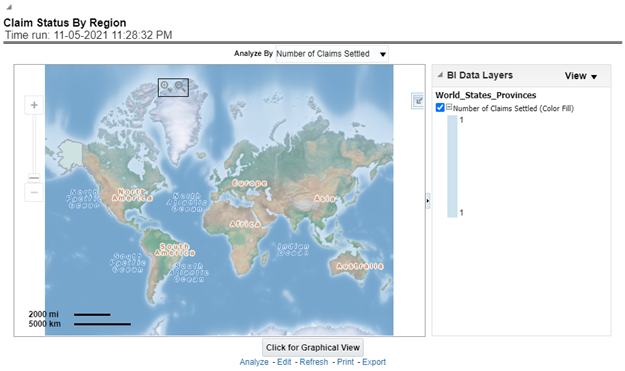
This report illustrates the count of claims by claims in a different status for the policies written by producers, for example, claims reported, claims settled, and claims in litigation. This report can be viewed over various periods, company, Region, product, and lines of business selected from page-level prompts. This report can be analyzed by agents and agencies.
Figure 6-218 Claim Status by Region
Claim Payments by Region
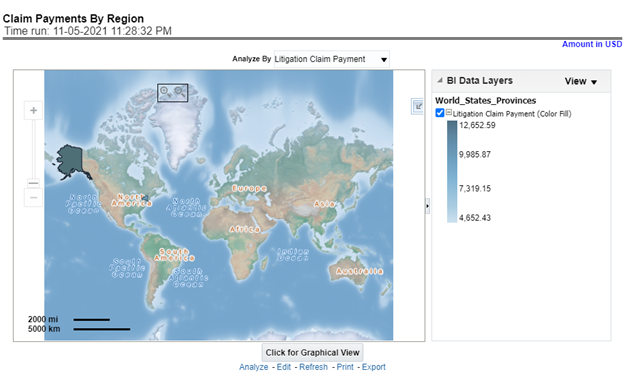
This report illustrates the claim payment like claim payments, catastrophic claim payments, and litigation claim payments through the geographical map and a drill through time series. This report can be viewed over various periods, company, Region, product, and lines of business selected from page-level prompts. This report can be analyzed by agents and agencies.
Figure 6-219 Claim Payments by Region
Producer Ranking by Region
This report consists of three further reports, which show:
- Ranking for the top ten best performing.
- Bottom ten least performing producers.
- Region-wise ranking by a number of customers through the map and tabular forms.
This report can be analyzed by agents and agencies.
This report can be further analyzed by clicking each region where top or bottom 10 producers are ranked for each region and their performance measurement for each ranked producer through the following performance key indicators:
- Policy Count
- Written Premium
- Bind (Conversion) Ratio
- Attrition Ratio
- Claim Count
Figure 6-220 Producer Ranking by Region
Top 10 Producers
Figure 6-221 Top 10 Producers

Bottom 10 Producers
Figure 6-222 Bottom 10 Producers
