5.2.1 Summary Tab

This tab includes information at the corporate level. The information contained in the reports generated summarizes how the entire organization is performing.

Following are the filters available for this tab.

  • Time
  • Company
  • Geography

The various reports available under this tab are detailed in the following sections.

Key Quote Performance Indicators Flash

This report shows snapshots of key performance indicators represented through flash boxes for the current period.

Figure 5-71 Key Quote Performance Indicators Flash


Key Quote Performance Indicators Flash

  • Flash Box: Quote Count Percentage Change: Quote Count Trends (Drill-down report): This report summarizes the count and distribution of the types of quotes generated during the reported period and compares those amounts to the previous reporting period. The comparisons available include a previous period or a previous year(s).
  • Flash Box: Quote Expenses Percentage Change: Quote Expenses Summary Trend (Drill-down report): This report summarizes the total amount of expenses by each type of quote for the reporting period and compares those amounts to the previous reporting period. The comparisons available include a previous period or a previous year(s).
  • Flash Box: New Business Bind ratio Percentage Change: New Business Quote to Bind Ratio (Drill-down report): This report presents the ratios of Total New Business Quotes that were generated vs. the New Business Quotes that were accepted and generated a new policy. The ratios are presented for the current and previous reporting periods. Also, it isolates and presents the binding ratio for quotes that had reports received for the current reporting period and the previous reporting period.
  • Flash Box: Quote to Canceled Ratio Percentage Change: Endorsement Quote to Canceled Ratio (Drill-down report): This report summarizes the ratio of policies where an endorsement quote was generated and remained in force until policy expiration and the policies where an endorsement quote was generated and the policy was later canceled. The ratios are presented for the current and previous reporting period and are exhibited in both tabular and graphical displays.
  • Flash Box: Quote to Expired Ratio Percentage Change: Renewal Quote to Expired Ratio (Drill-down report): This report summarizes the ratio of policies where a renewal quote was generated and the policy renewed and the policies where a renewal quote was generated and the policy later expired. The ratios are presented for the current and previous reporting period and are exhibited in both tabular and graphical displays.

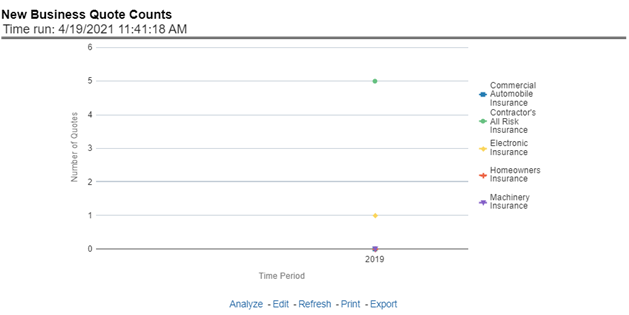
New Business Quote Counts

This line graph illustrates the total number of New Business quotes generated over time. Each Line of business is represented by a unique line.

Figure 5-72 New Business Quote Counts


New Business Quote Counts

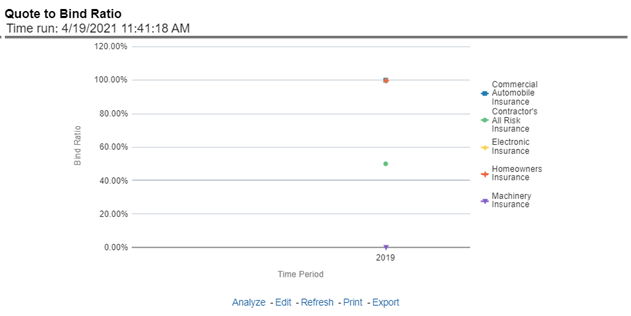
Quote to Bind Ratio

This line graph illustrates the Binding ratio, the ratio of total quotes generated to those quotes that resulted in a policy transaction including but not limited to new business policy or endorsement, over time. Each Line of business is represented by a unique line.

Figure 5-73 Quote to Bind Ratio


Quote to Bind Ratio

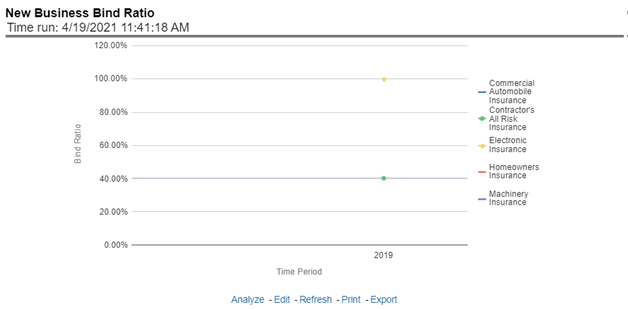
New Business Bind Ratio

This line graph illustrates the New Business Bind ratio, the ratio of total New Business quotes generated to those quotes that resulted in a new business policy transaction, over time. Each Line of business is represented by a unique line.

Figure 5-74 New Business Bind Ratio


New Business Bind Ratio

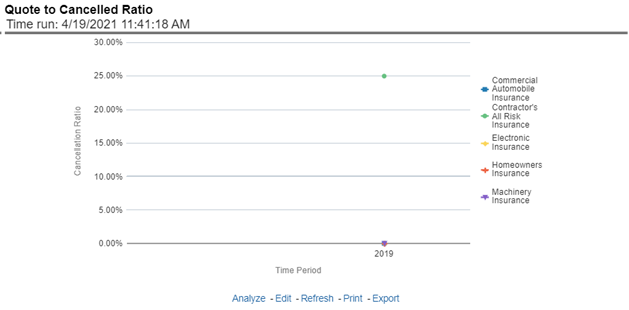
Quote to Cancelled Ratio

This line graph illustrates the Quote to Canceled ratio, the ratio of total policies with endorsements quotes generated to those policies with an endorsement quote that eventually canceled, over time. Each Line of business is represented by a unique line.

Figure 5-75 Quote to Cancelled Ratio


Quote to Cancelled Ratio

Quote Counts by Type

This pie graph illustrates the count of quotes by the type of quote. The types of quotes illustrated include the following:

  • New Business
  • Endorsement
  • Cancellation
  • Reinstatement
  • Renewal
The corresponding stacked bar graph shows the total quotes stacked by the type of quotes over a time series.

Figure 5-76 Quote Counts by Type


Quote Counts by Type

Top 10 Producing Agency New Business Quote Count

This chart lists the Producing Agencies with the 10 highest New Business Quote Count for the reporting period. This chart also lists the agencies' prior quote count for reference. The Rank of 1 is for the highest quote count of the top 10, the Rank of 10 is for the lowest quote count for the count of the top 10.

Figure 5-77 Top 10 Producing Agency New Business Quote Count


Top 10 Producing Agency New Business Quote Count

Top 10 Producing Agents New Business Quote Count
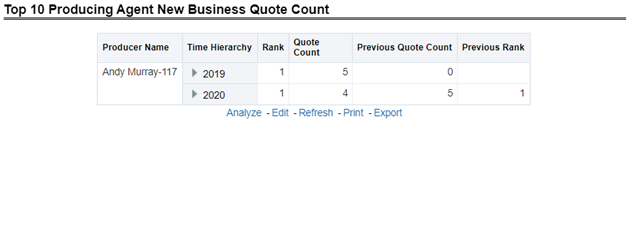
This chart lists the Producing Agents with the 10 highest New Business Quote Count for the reporting period. This chart also lists the agents' prior quote count for reference. The Rank of 1 is for the highest quote count of the top 10, the Rank of 10 is for the lowest quote count for the count of the top 10.

Figure 5-78 Top 10 Producing Agents New Business Quote Count


Top 10 Producing Agents New Business Quote Count

Top 10 Producing Agency Binding Ratio

This chart lists the Producing Agencies with the 10 highest Binding Ratio, the ratio of total quotes generated to those quotes that resulted in a policy transaction including but not limited to new business policy or endorsement, for the reporting period. This chart also lists the agencies' prior binding ratio for reference. The Rank of 1 is for the highest binding ratio of the top 10, the Rank of 10 is for the lowest binding ratio for the count of the top 10.

Figure 5-79 Top 10 Producing Agency Binding Ratio


Top 10 Producing Agency Binding Ratio

Top 10 Producing Agent Binding Ratio

This chart lists the Producing Agents with the 10 highest Binding Ratio, the ratio of total quotes generated to those quotes that resulted in a policy transaction including but not limited to new business policy or endorsement, for the reporting period. This chart also lists the agents' prior binding ratio for reference. The Rank of 1 is for the highest binding ratio of the top 10, the Rank of 10 is for the lowest binding ratio for the count of the top 10.

Figure 5-80 Top 10 Producing Agent Binding Ratio


Top 10 Producing Agent Binding Ratio

Top 10 Producing Agency Expense Ratio

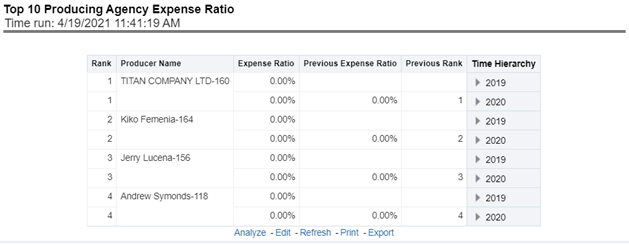
This chart lists the Producing Agencies with the 10 highest Expense Ratio, the ratio of total expenses generated for an agency's policies to the written premium for the same policies, for the reporting period. This chart also the agencies' prior expense ratio for reference. The Rank of 1 is for the highest expense ratio of the top 10 and the Rank of 10 is for the lowest expense ratio for the count of the top 10.

Figure 5-81 Top 10 Producing Agency Expense Ratio

Top 10 Producing Agency Expense Ratio

Top 10 Producing Agent Expense Ratio

This chart lists the Producing Agents with the 10 highest Expense Ratio, the ratio of total expenses generated for an agent's policies to the written premium for the same policies, for the reporting period. This chart also lists the agents' prior expense ratio for reference. The Rank of 1 is for the highest expense ratio of the top 10 and the Rank of 10 is for the lowest expense ratio for the count of the top 10.

Figure 5-82 Top 10 Producing Agent Expense Ratio


Top 10 Producing Agent Expense Ratio