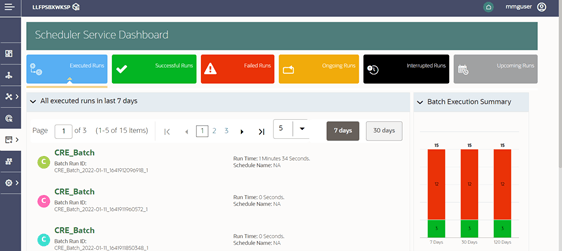
Scheduler Service Dashboard
This dashboard is the landing page of the Scheduler. On this page, you can view the
following details:
- • Tabs such as Executed Runs, Successful Runs, Failed Runs, Ongoing Runs, Interrupted Runs, and Upcoming Runs. You can click the tabs to view the details of the Batches based on their status. For example, click Ongoing Runs to view the details of the batches that are currently running.
- The Batches that were executed in the last 7 days with details such as Batch Name, Batch Run ID, and Run-Time. Click 30 days to view the batches executed over the last 30 days. You can click the icon corresponding to a Batch to monitor it.
- The Batch Execution Summary Pane displays the count of
total batches executed for the last 7 days, 30 days, and 120 days. Additionally,
you can view the separate count of successful batches, failed batches,
interrupted batches, ongoing batches, and the batches that are yet to begin, by
placing your cursor over the color given for each batch status.
Figure 22-7 The Scheduler Service Dashboard
