6.3.1.3 Report Data Action
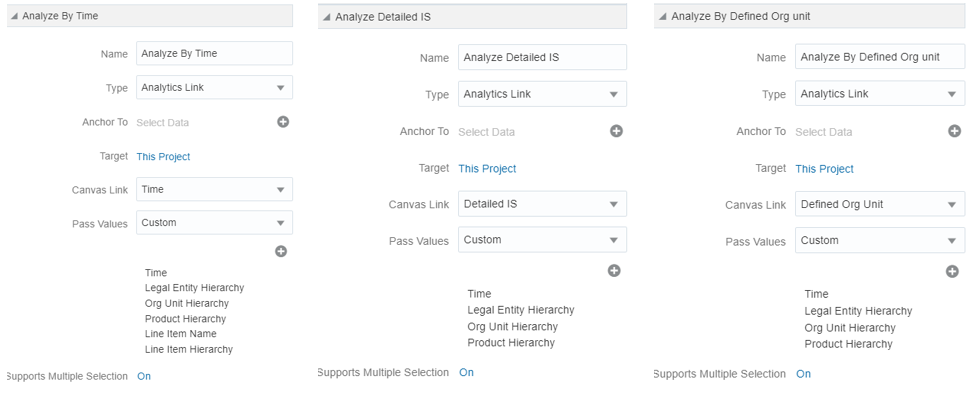
Figure 6-16 Data Action configuration in Top Down Summary canvas

From every chart available in “Top Down Summary”, except for “Net Interest Income” and “Net Interest Margin” charts, you can select a value, and then navigate to the Time, Detailed Income Statement and Defined Org Unit canvas.
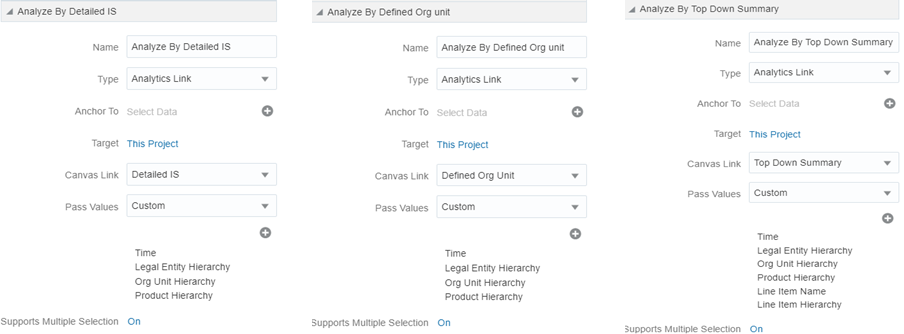
Figure 6-17 Data Action configuration in Time canvas

From every chart available in the Time canvas, you can select a value, and then navigate to the Top Down Summary, Detailed Income Statement and Defined Org Unit canvas.
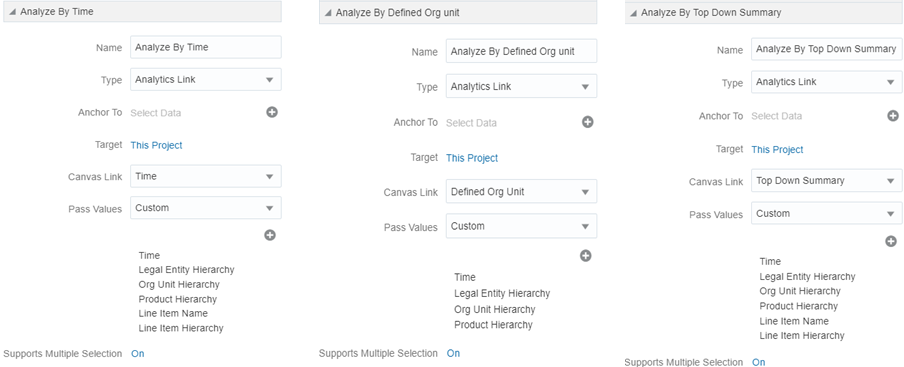
Figure 6-18 Data Action configuration in Detailed Income Statement canvas

Note that although Line Item Name and Hierarchy appear as a pass value, tool limitation currently limits passing these values to the other canvases.
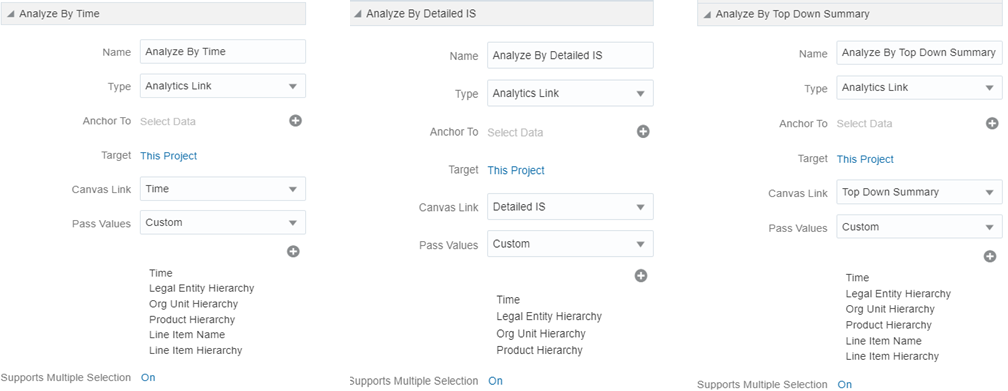
Figure 6-19 Data Action configuration in Defined Org Unit canvas

From every chart available in the Defined Org Unit canvas, you can select a value, and then navigate to the Time, Detailed Income Statement or Top Down Summary canvas.
In order to do so, with a right click on the chart selection, the data action option will appear for you to be able to navigate to the canvas you selected.