5.4.1.8 Defined Org Unit
The Defined Org Unit report provides a view of the Top Down Ledger Data for different Organizational Units. The canvas empowers all org owners to access actionable profitability insight directly. The users can then assess risk-adjusted metrics such as return on assets (ROTA), return on Net Interest Margin (NIM), risk-adjusted return on capital (RAROC) or key performance indicators such as top 10 products by balance growth.
You can use a series of Report Prompts, as previously described, to filter the data. In addition, there are In-Report prompt selections to select the Top/ Bottom N org units that you are interested in, and the corresponding data will be displayed.
- Org Unit wise contribution for Reporting Line (TOP N);
the same is available for bottom viewIn this chart, for the selected reporting line, the Top N (N selected from the chart prompt) and bottom N organization units are displayed in descending order of value of the reporting line.
Figure 5-65 Income Statement Reporting Line

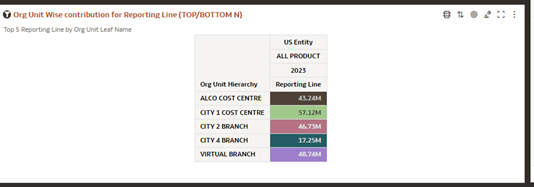
- Org Unit wise contribution for Reporting Line (TOP/ BOTTOM
N): The same is available for bottom view In this chart, for the
selected reporting line, the Top N (N selected from the chart prompt) and bottom
N organization units are displayed in descending order of value of the reporting
line.
Figure 5-66 Org Unit wise contribution for Reporting Line (TOP/BOTTOM N)
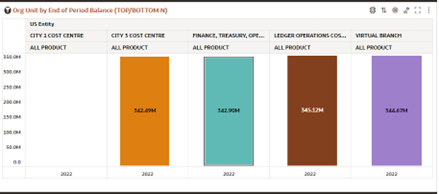
- Org Unit by End of Period Balance (TOP/ BOTTOM N): the
same is available for bottom view The chart displays the Top N (N selected from
the chart prompt) and bottom N organization units sorted in a descending order
by End of Period Balances.
Figure 5-67 Org Unit by End of Period Balance (TOP/BOTTOM N)
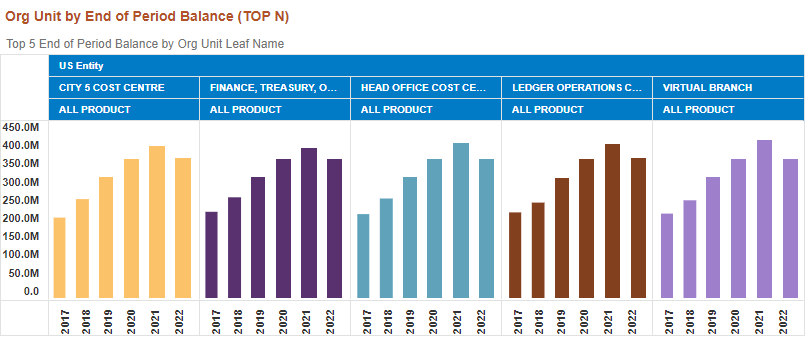
- Org Unit by End of Period Balance (TOP N); the same is available for
bottom viewThe chart displays the Top N (N selected from the chart prompt) and bottom N organization units sorted in a descending order by End of Period Balances.
Figure 5-68 Org Unit by End of Period Balance (TOP N)
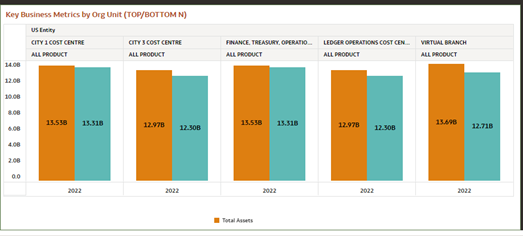
- Key Business Metrics by Org Unit (TOP/ BOTTOM N): the
same is available for bottom view The chart displays the Top N (N selected from
the chart prompt) and bottom N organization units sorted in a descending order
by End of Period Balances and provides the breakup between Asset and Liability
Balances.
Figure 5-69 Key Business Metrics by Org Unit (TOP/BOTTOM N)
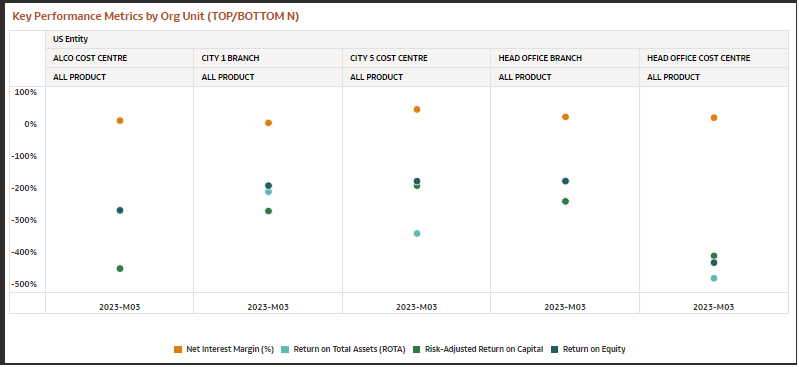
- Key Performance Metrics by Org Unit (TOP/ BOTTOM N): the
same is available for bottom view The chart displays the Top N (N selected from
the chart prompt) and bottom N organization units sorted in a descending order
by End of Period Balances and provides selected KPI’s like NIM and ROTA of these
Org Units.
Figure 5-70 Key Performance Metrics by Org Unit (TOP/ BOTTOM N)
