5.5.1.10 Other Insights
The Other Insights report provides granular information on account and customer distribution. This data help banks manage their investments efficiently and invest in areas that are of strategic and financial importance to the bank. You can use a series of Report Prompts, as previously described, to filter the data.
- Number of Accounts and Customers
Distribution: The chart displays business metrics like Number of
Accounts and Number of Customers for the selected Region, Org Unit and Product
hierarchy.
Figure 5-120 Number of Accounts and Customers Distribution

- Number of Accounts dissemination by Geography, Org Unit,
and Product: As the name implies, this chart provides a breakup
of the number of accounts by Region, Org Unit and Product.
Figure 5-121 Number of Accounts dissemination by Geography, Org Unit and Product

- Number of Customers dissemination by Geography, Org Unit,
and Product: As the name implies, this chart provides a breakup
of the number of customers by Region, Org Unit and Product.
Figure 5-122 Number of Customers dissemination by Geography, Org Unit and Product

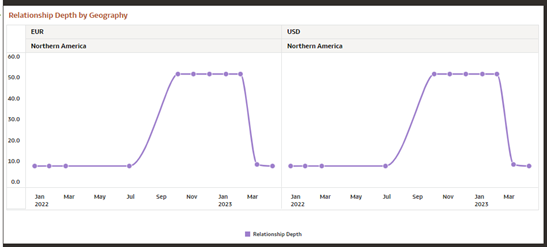
- Relationship Depth by Geography: Relationship depth
indicates the number of accounts per customer. In this report, this is reported
as per Geography.
Figure 5-123 Relationship Depth by Geography

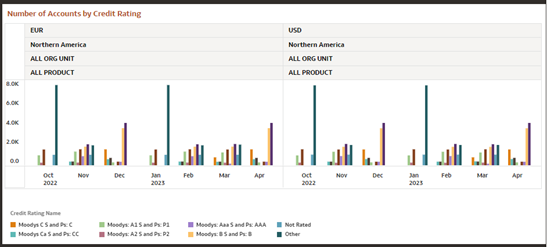
- Number of Accounts by Credit Rating Report: This report
shows the credit rating distribution for the accounts in the portfolio, thus
giving an indication of the health of the portfolio in terms of risk.
Figure 5-124 Number of Accounts by Credit Rating Report

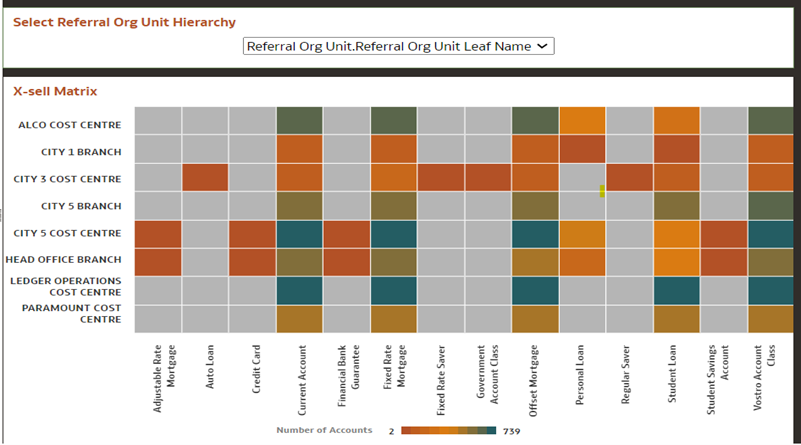
- X-sell Matrix (Number of Accounts) Report: This report
shows a product wise distribution of the number of accounts that have been
X-sold from a specific org unit that is selected from the dropdown, Selecting
the leaf level option will display the X-sell Matrix.
Figure 5-125 X-sell Matrix (Number of Accounts) Report

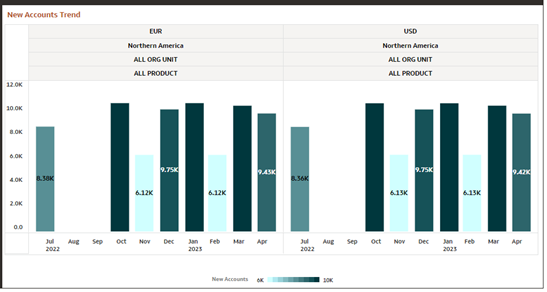
- New Accounts Trend Report: This report shows a product
wise view of the new account openings during the selected time period. This can
also ve viewed as per the org unit or region.
Figure 5-126 New Accounts Trend Report
