The Top Down Summary Report provides a view of the descriptive analytics related to
the heads of Income and Expenses.
You can use a series of Report Prompts, as previously described, to filter
the data according to key attributes pertaining to the underlying Management Ledger
tables. The canvas provides a summary view to key management reports for better
performance tracking and profitability management. Distribution of Assets and
Liabilities at enterprise and Income statement Analysis at enterprise/ Legal entity, Org
Unit, and Product level along with Impact of on NII and NIM.
The report displays the underlying data according to the following Charts’
logic:
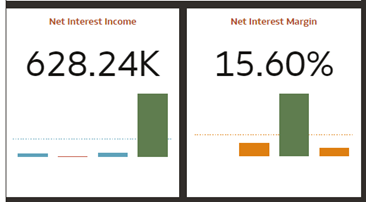
- Net Interest Income and Net Interest Margin:
The chart displays the absolute value for the Net Interest Income and the Net
Interest Margin as a percentage for the selected time level. NIM is usually Net
Interest Income expressed as a percentage that is, it is the net interest income
a bank or financial institution earns in percentage terms on the average
interest-earning assets in a specified period.
Income Statement: The income statement is a financial
statement that shows you the bank's income and expenditures. It also shows whether the
bank is making profit or loss for the given period. The Top Down Summary canvas displays
a summary Income statement showing selected reporting lines with a dedicated canvas for
the detailed statement showing reporting lines at multiple levels. Using the filter
prompt in the chart you can select the 2 periods you want to compare.
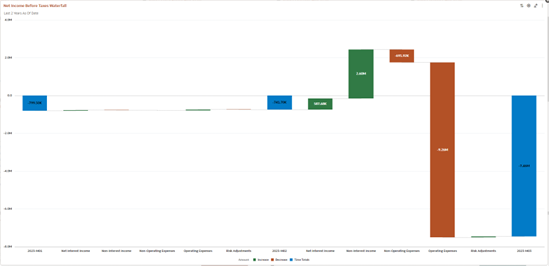
Net Income Before Taxes Waterfall: The NIBT waterfall
shows the incremental contribution of the displayed reporting lines over the base period
that has been selected as the comparison point. For this report, the default view is of
the last two time periods.
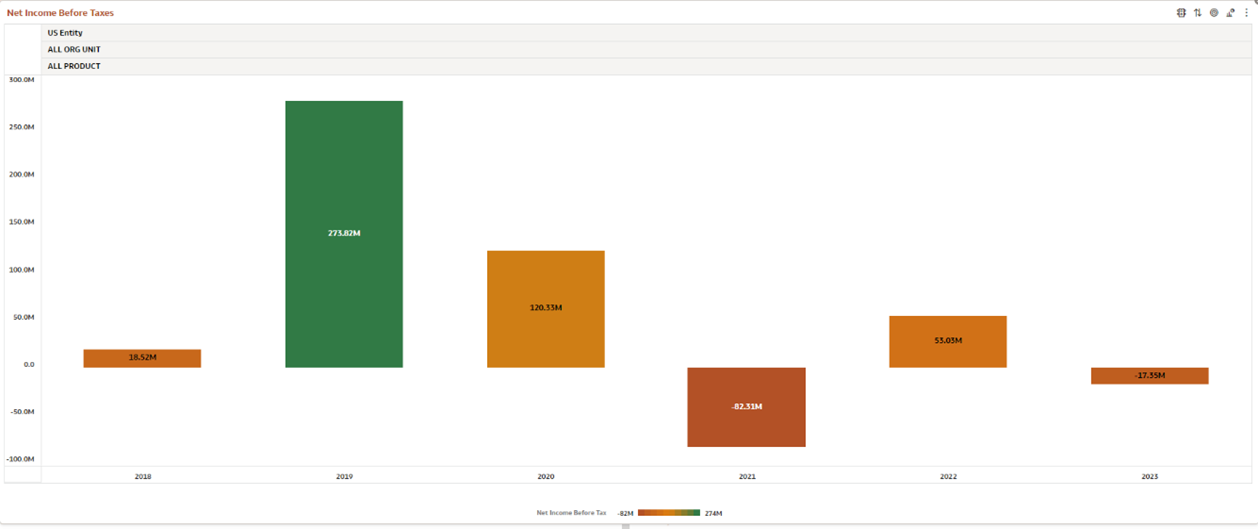
Net Income Before Taxes: The chart displays the
absolute value for the Net Income Before Taxes for the selected time period/s. The
default view of this chart is for the last 5 years from the current As-of-Date.
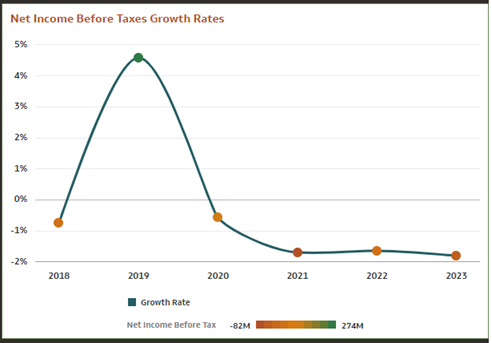
Net Income Before Taxes Growth Rates: The chart
displays the relative percentage variation of NIBT that is calculated over the previous
period available as per the selection.
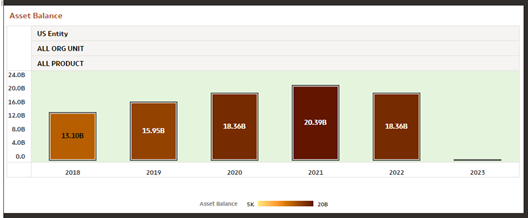
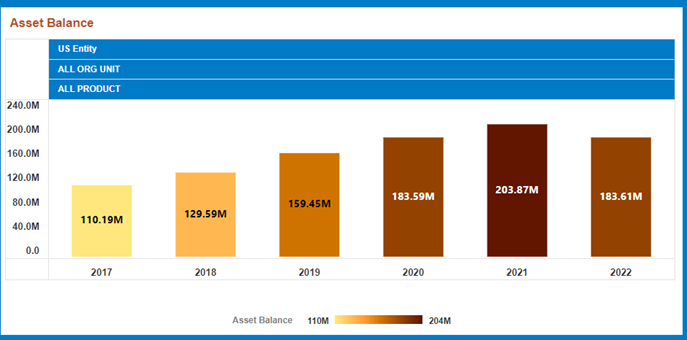
Asset Balance: The chart displays the absolute value
for Asset Balances for the selected time period/s. The default view of this chart is for
the last 5 years from the current As-of-Date.
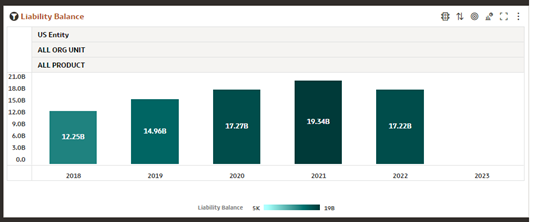
Liability Balance: The chart displays the absolute
value for Liability Balances for the selected time period/s. The default view of this
chart is for the last 5 years from the current As-of-Date.
Asset and Liability Balance Growth Rates: The chart
displays the relative percentage variation of Asset and Liability balance values that is
calculated over the previous period available as per the selection. The default view of
this chart is a comparison over the past 5 years.
