5.6.1.11 Geography Profitability Report
When you select the Geographic location and map it to the key dimensions of Profitabiity Analytics, the Profitability Insights Geography Profitability report which displays all the summary measures of profitability, KPI’s and Business metrics. These are revenue, end of period balance, total assets, total liabilities, regulatory capital, economic capital, net interest margin, return on total assets, risk-adjusted return on capital, return on equity, net fee income, gross interest income, interest coverage ratio and operating expense ratio.
To feed the Geography Profitability Report, refer to the Oracle Financial Services Profitability Analytics Cloud Service Dataflow document in the available on the Doc ID: 2869409.1.
For the Profitability Insights Report refer to the following dataflow sub-sections:
- PACS - Instrument Summary
- PACS - Instrument Geography
Overall Layout of Geography Canvas
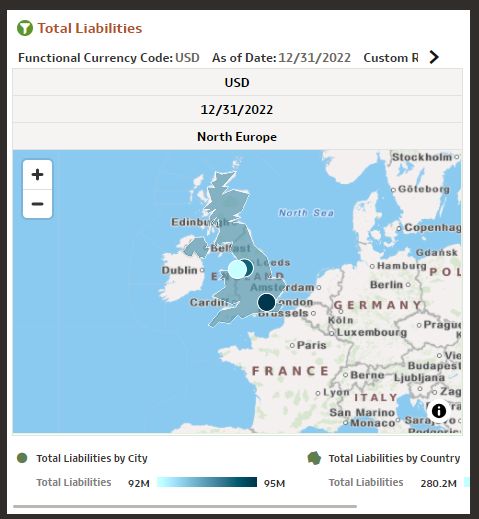
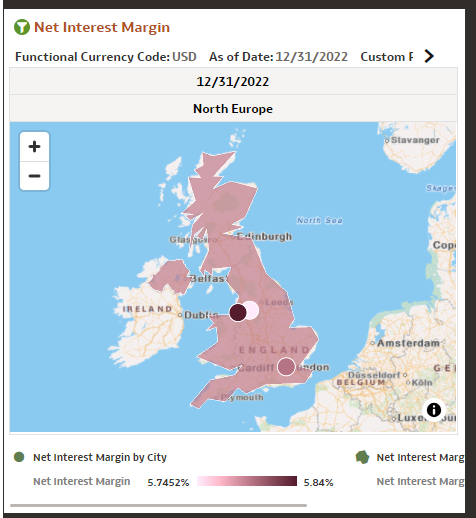
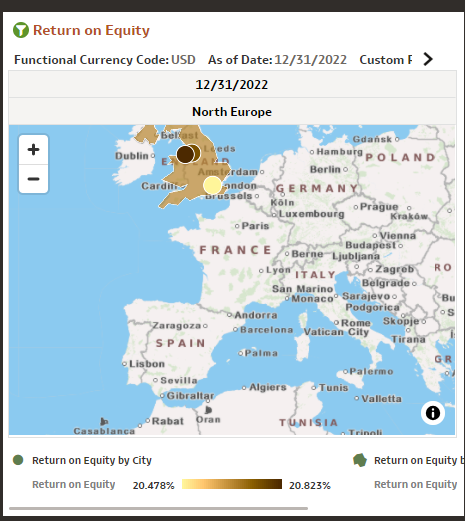
All reports in the Geography Canvas have two layers: one for the city and another for the country. The colour gradation is self explanatory and varies as per the value of the metric or measure depicted. Because of the presence of twwo layers, the overall map is coloured as the average value of the measure. This colour can be disabled by clicking on the polygon corresponding to the overall map.
The Summary canvas in Geography Profitability provides a map based depiction of profitability measures as follows:
Figure 5-136 Overall Layout of Geography Canvas
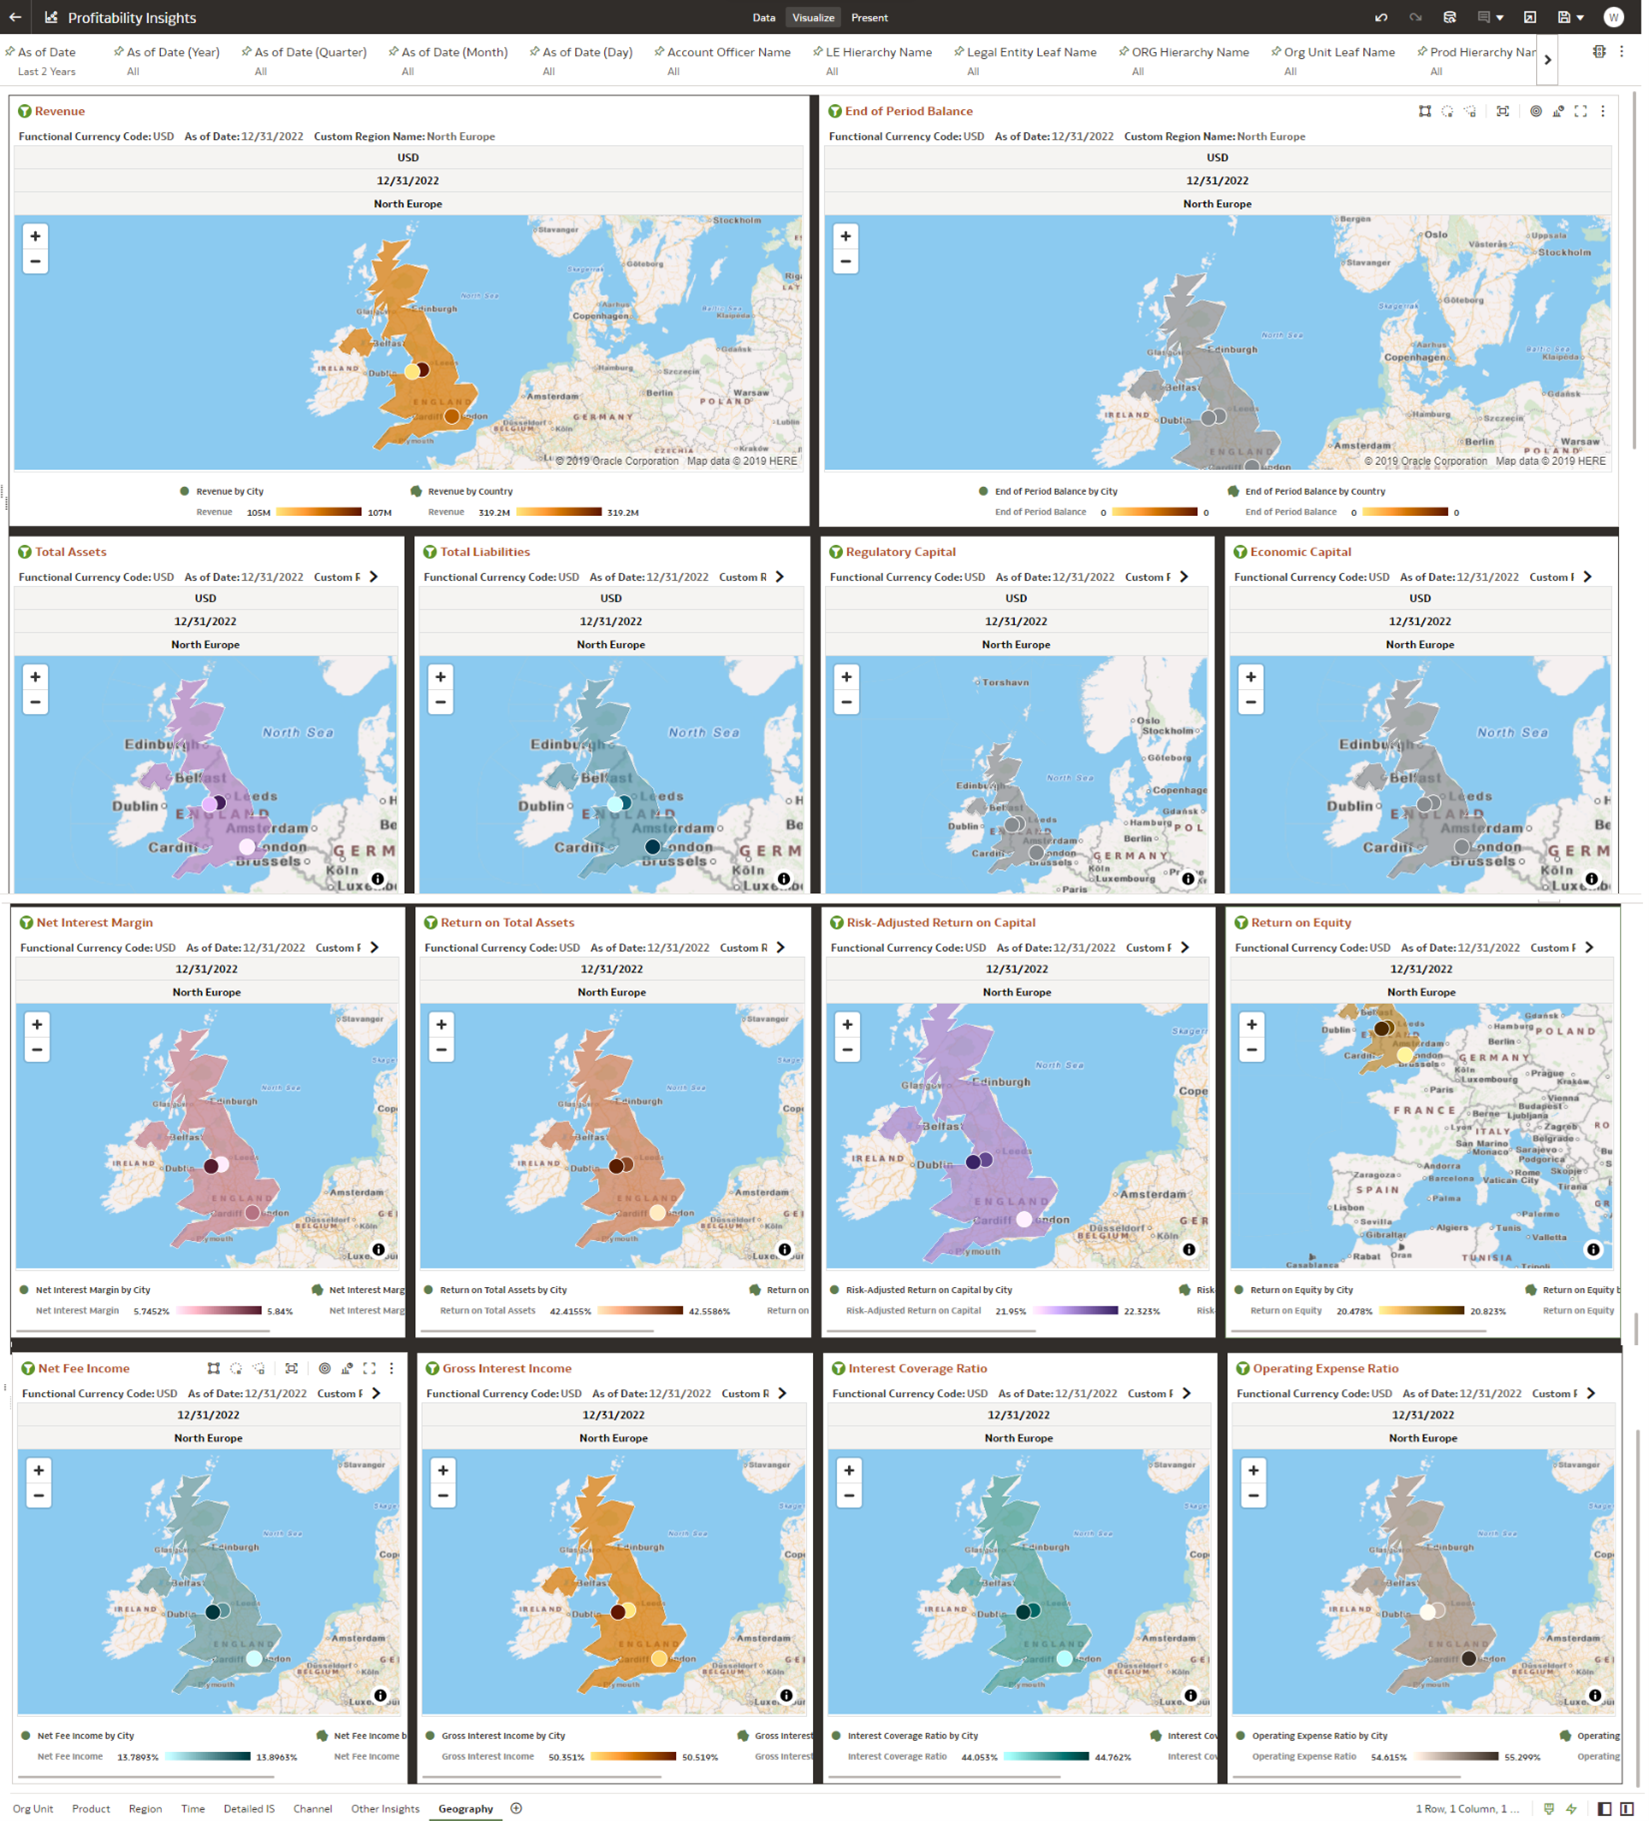
Figure 5-137 Revenue
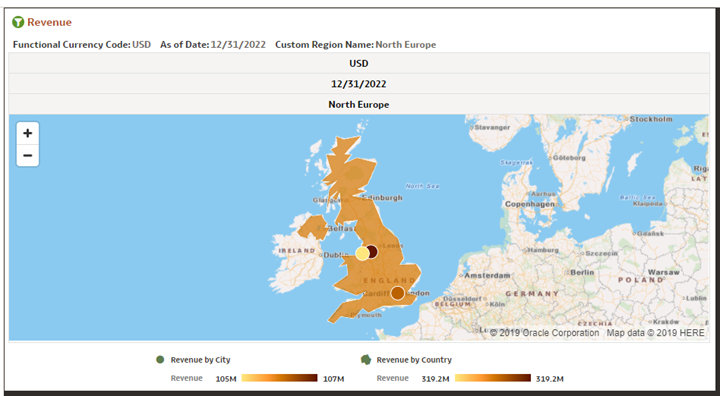
Figure 5-138 End of Period Balance
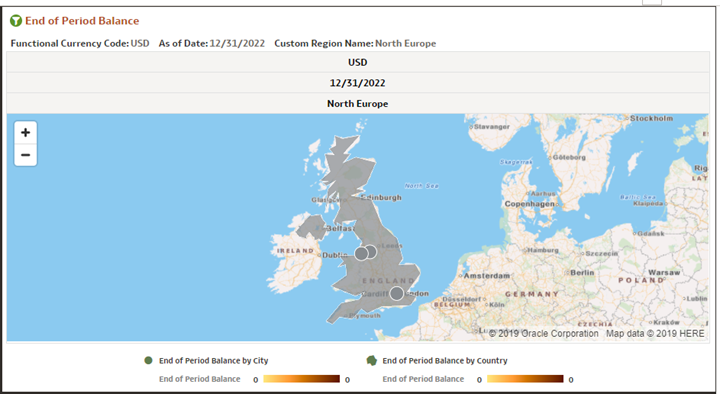
Figure 5-139 Total Assets
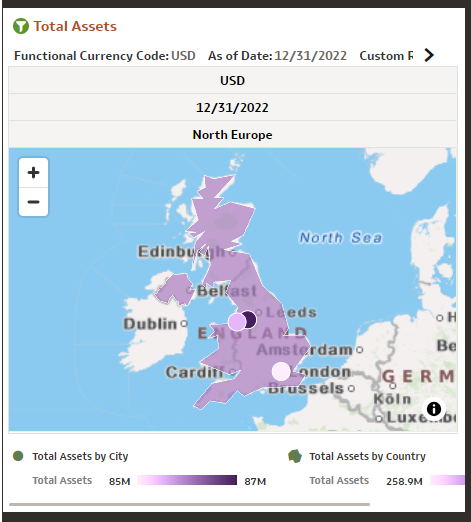
Figure 5-140 Total Liabilities
Key Business Metrics
The Key Business Metrics canvas within Geography Profitability provides a map based depiction of profitability measures as follows:
Figure 5-141 Regulatory Capital
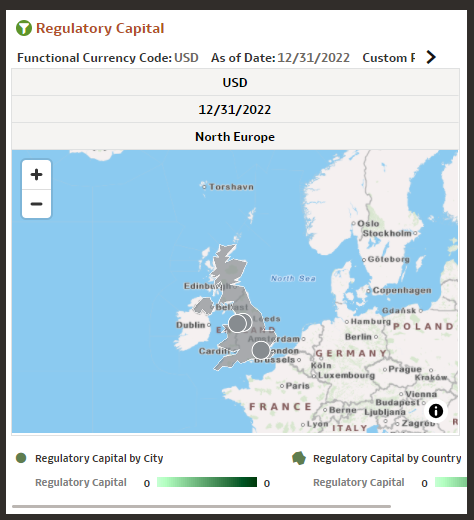
Figure 5-142 Economic Capital
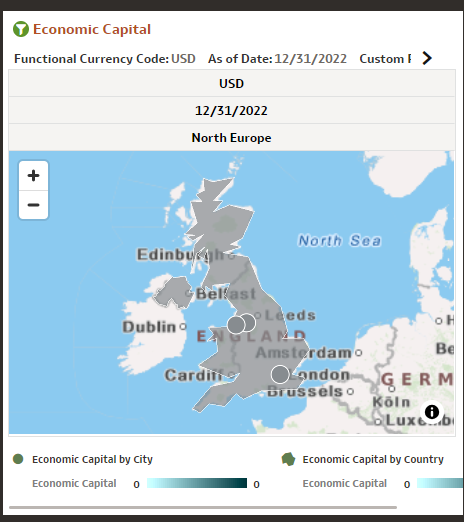
Figure 5-143 Net Interest Margin
Key Performance Metrics
The Key Performance Metrics canvas within Geography Profitability provides a map based depiction of profitability measures as follows:
Figure 5-144 Return on Total Assets
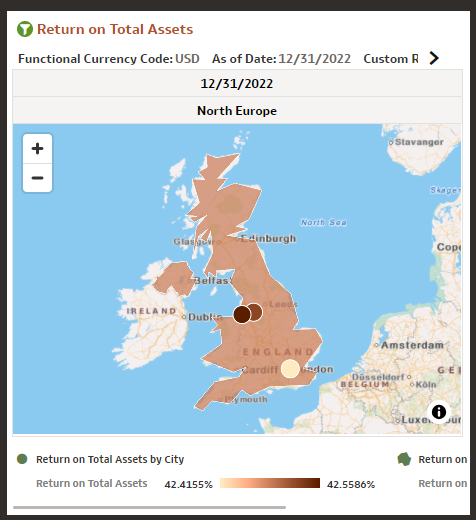
Figure 5-145 Risk-Adjusted Return on Capital
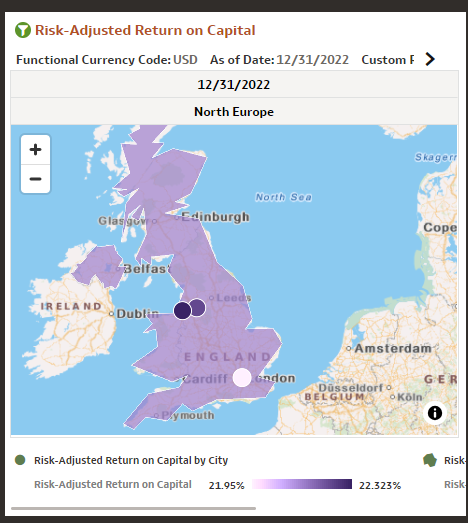
Figure 5-146 Return on Equity
Other Ratios
The Other Ratio’s canvas within Geography Profitability provides a map based depiction of profitability measures as follows:
Figure 5-147 Net Fee Income
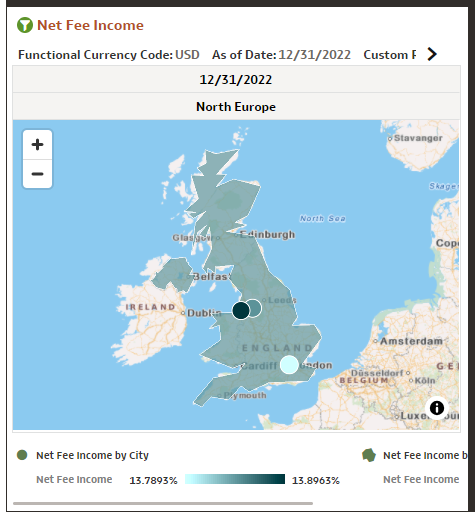
Figure 5-148 Gross Interest Income
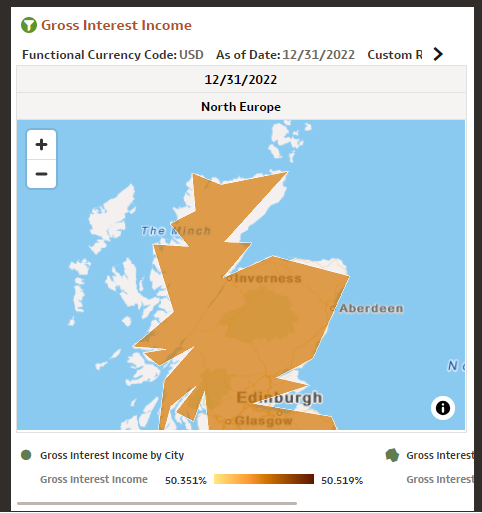
Figure 5-149 Interest Coverage Ratio
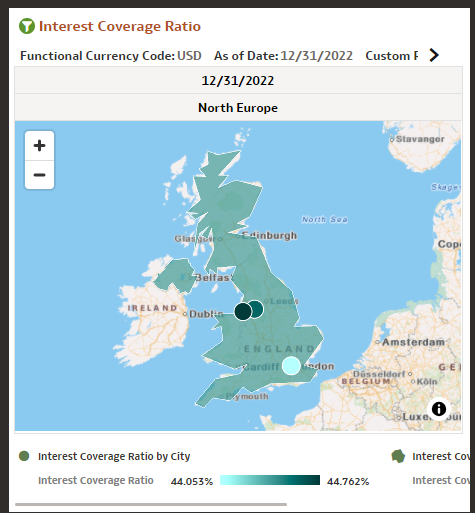
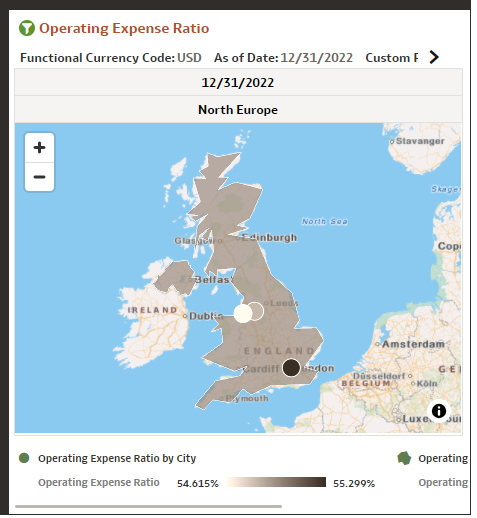
Figure 5-150 Operating Expense Ratio
