Churn Model Predictions
The Churn Model Predictions screen displays customer-level churn prediction results generated by a churn model.
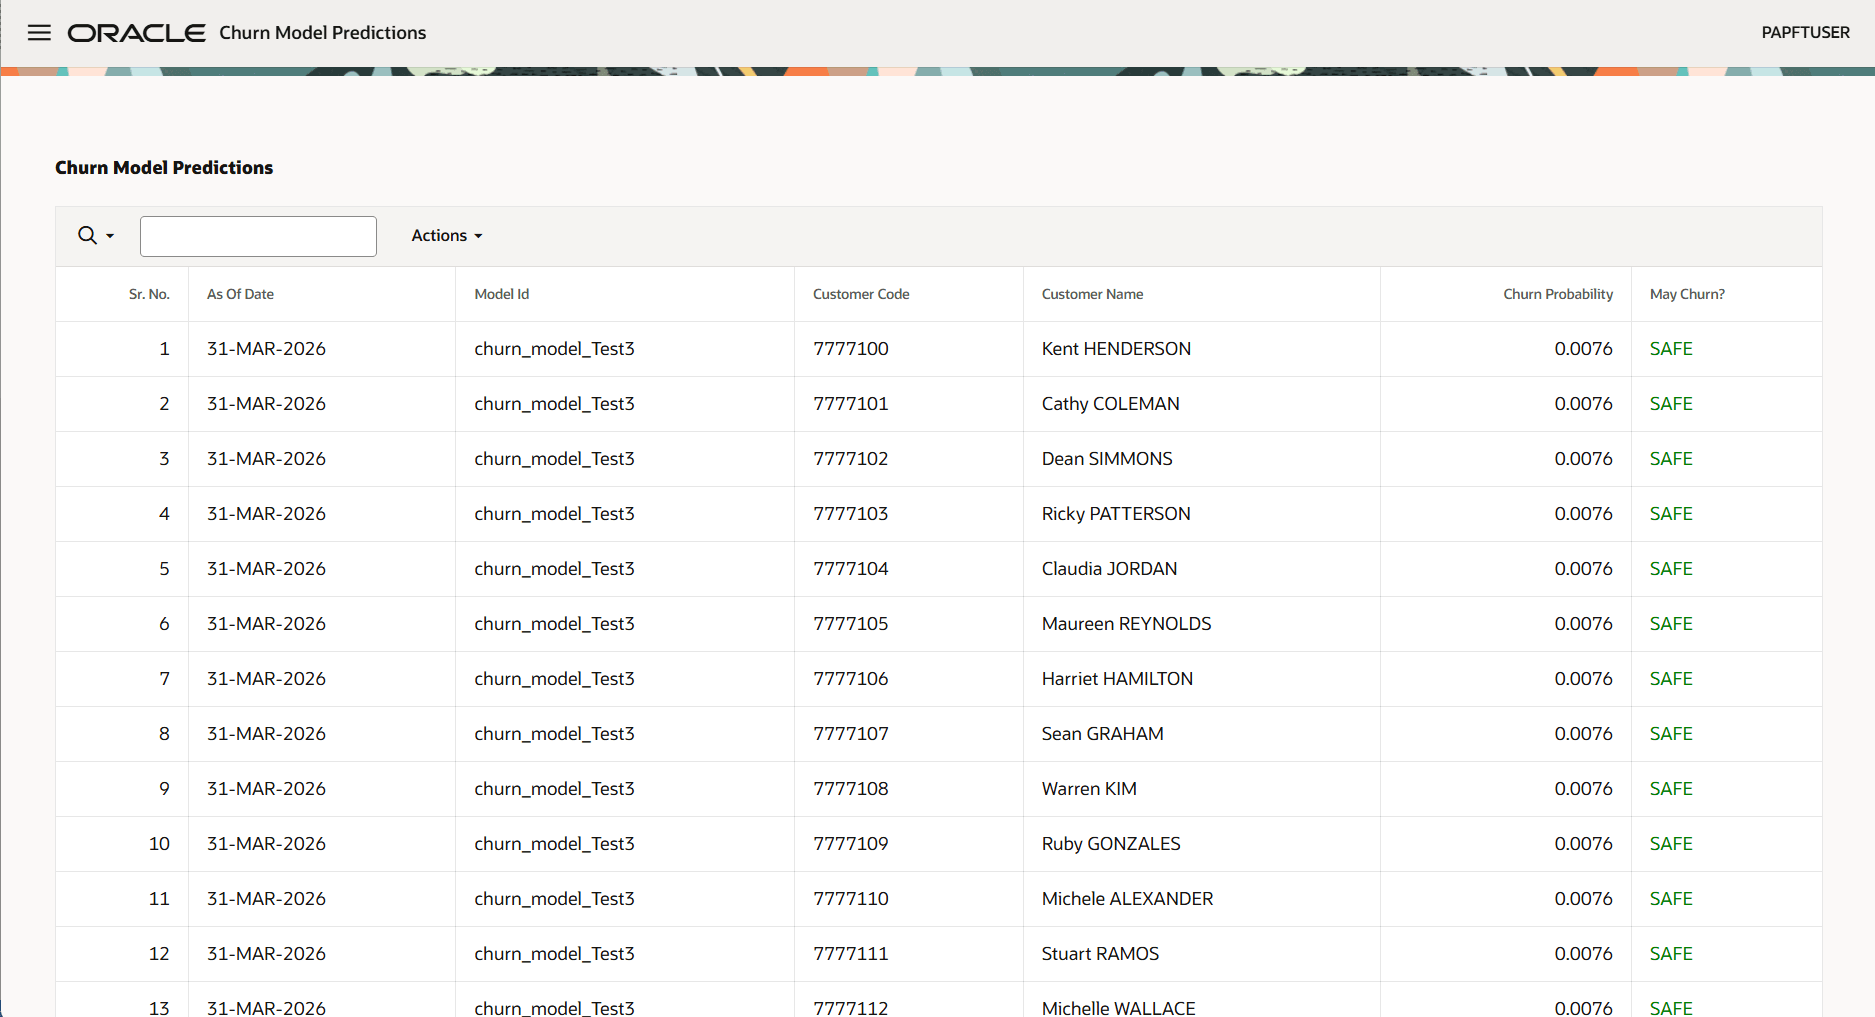
Figure 6-34 Churn Model
Search and Actions
The toolbar provides:
- A Search control to choose the a specific field to search, such as:
- Sr. No.
- As Of Date
- Model Id
- Customer Code
- Customer Name
- Churn Probability
- May Churn?
- A search input field for entering search criteria.
- An Actions menu for performing available operations on the displayed data.
The results are displayed in a table with the following columns:
- Sr. No. — Sequential number of the record.
- As Of Date — Date associated with the prediction.
- Model Id — Identifier of the churn model used to generate the prediction.
- Customer Code — Unique customer identifier
- Customer Name — Name of the customer.
- Churn Probability — Predicted probability that the customer may churn.
- May Churn? — Churn classification based on the model prediction.
- SAFE: Indicates that the customer is unlikely to churn.
- CHURN: Indicates that the customer may churn.
Use the Actions panel to configure and manage the data displayed in the table. The panel provides the following options:
- Columns: Show or hide table columns and adjust their display order.
- Filter:Filter the dataset based on row and column properties.
- Data: Use the Data menu to manage and update the dataset displayed in the table using the following options:
- Refresh: Reload the data to display the most current information.
- Flashback: View data as it existed at a specified time in the past.
- Format: Use the Format menu to modify the visual presentation of data using the following options:
- Control Break: Define grouping of table data based on a selected column.
- Highlight: Highlight row or column based on defined conditions.
- Stretch Column Widths: Manually adjust column widths to fit the available screen space.
- Chart: Use the Chart menu to create a visual representation of the current dataset.
- Report: Generate a formatted report based on the displayed data.
- Download: Export the data for offline use in supported file formats.