Daily Trends
The Daily Trends screen provides a day-by-day view of Oracle Analytics usage activity, including rows returned, query volume, and distinct users.
The Rows Returned chart shows the number of rows returned for each day, along with query count and the average rows returned. The Queries Run chart shows the number of queries and users for each day, together with the average query count. The Distinct Users chart shows the number of unique users for each day.
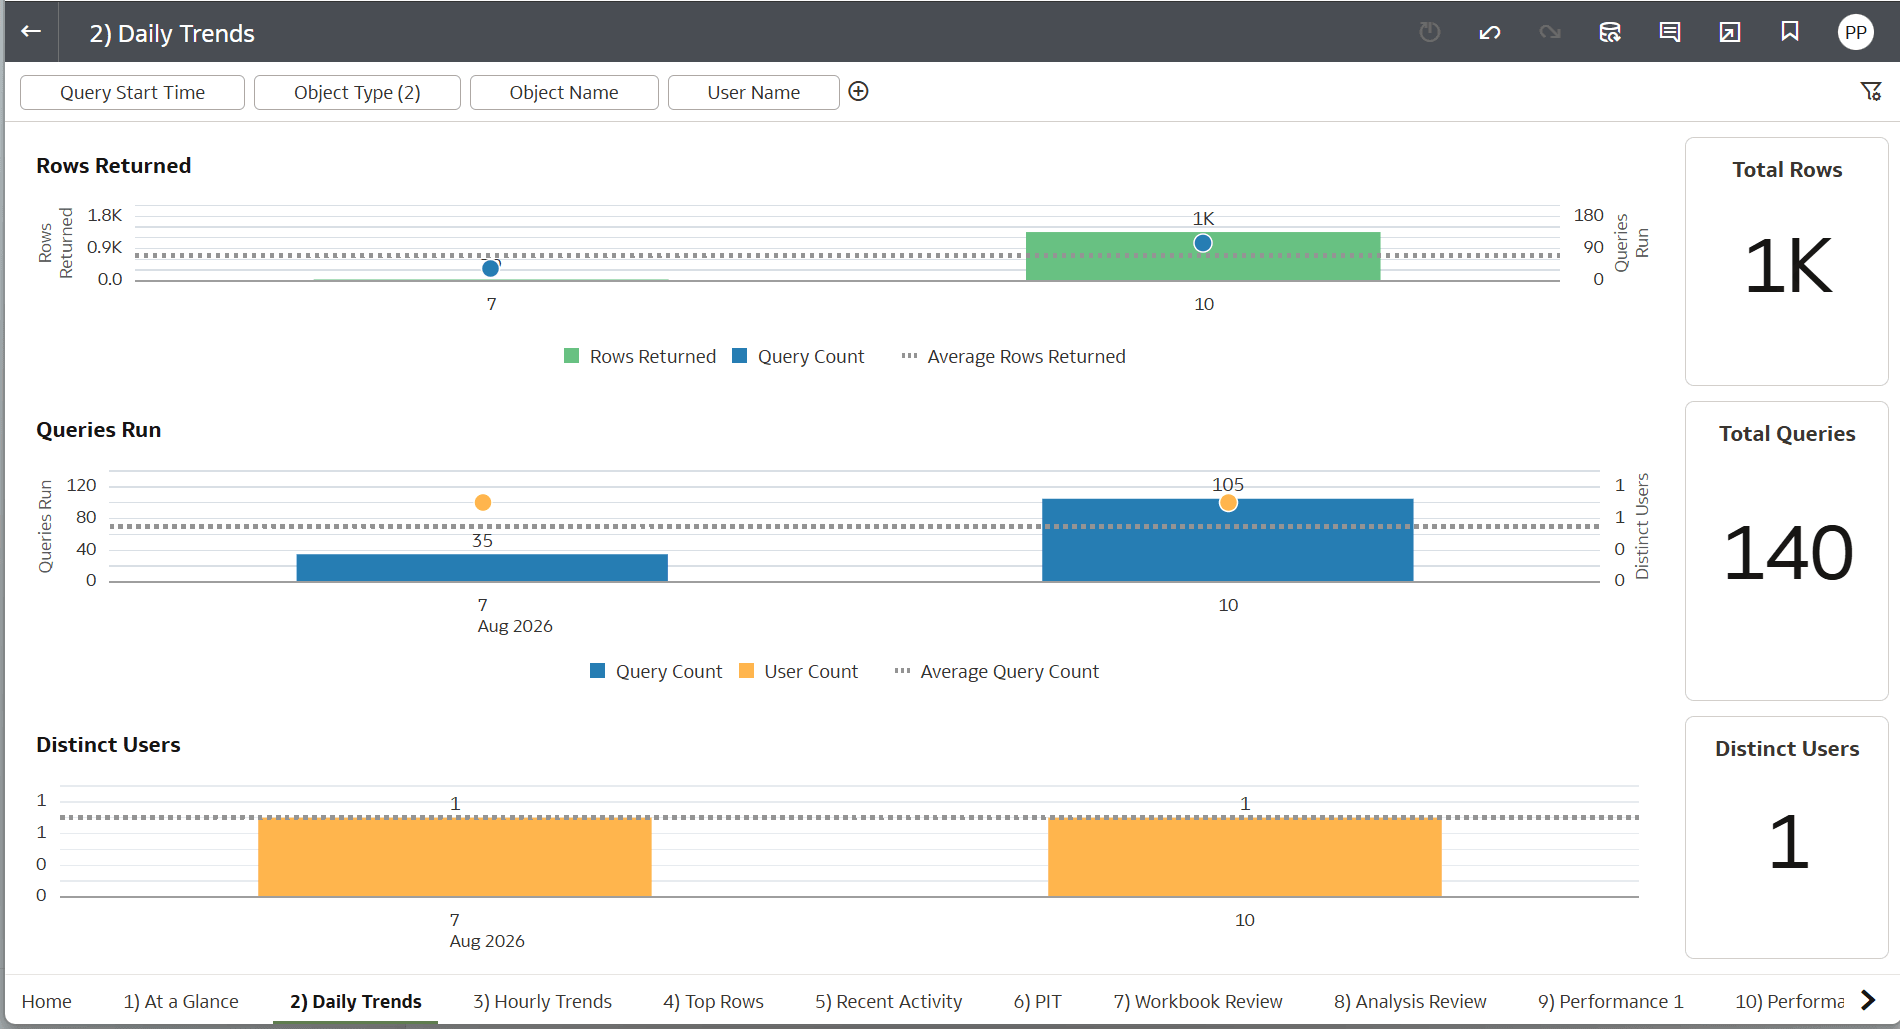
Figure 9-43 Daily Trends
The top section provides filters to narrow the displayed results based on:
- Query Start Time
- Object Type
- Object Name
- User Name