Usage Analytics
The Usage Analytics Home screen provides access to Oracle Analytics Cloud usage-tracking dashboards and performance analysis views.
To access the Usage Analytics reports: Click Analytics > Home Page. On the Analytics page, click the hamburger menu on the left, then select Catalog. Navigate to Shared Folders > Operational Analysis > Usage Analytics to view the available reports.
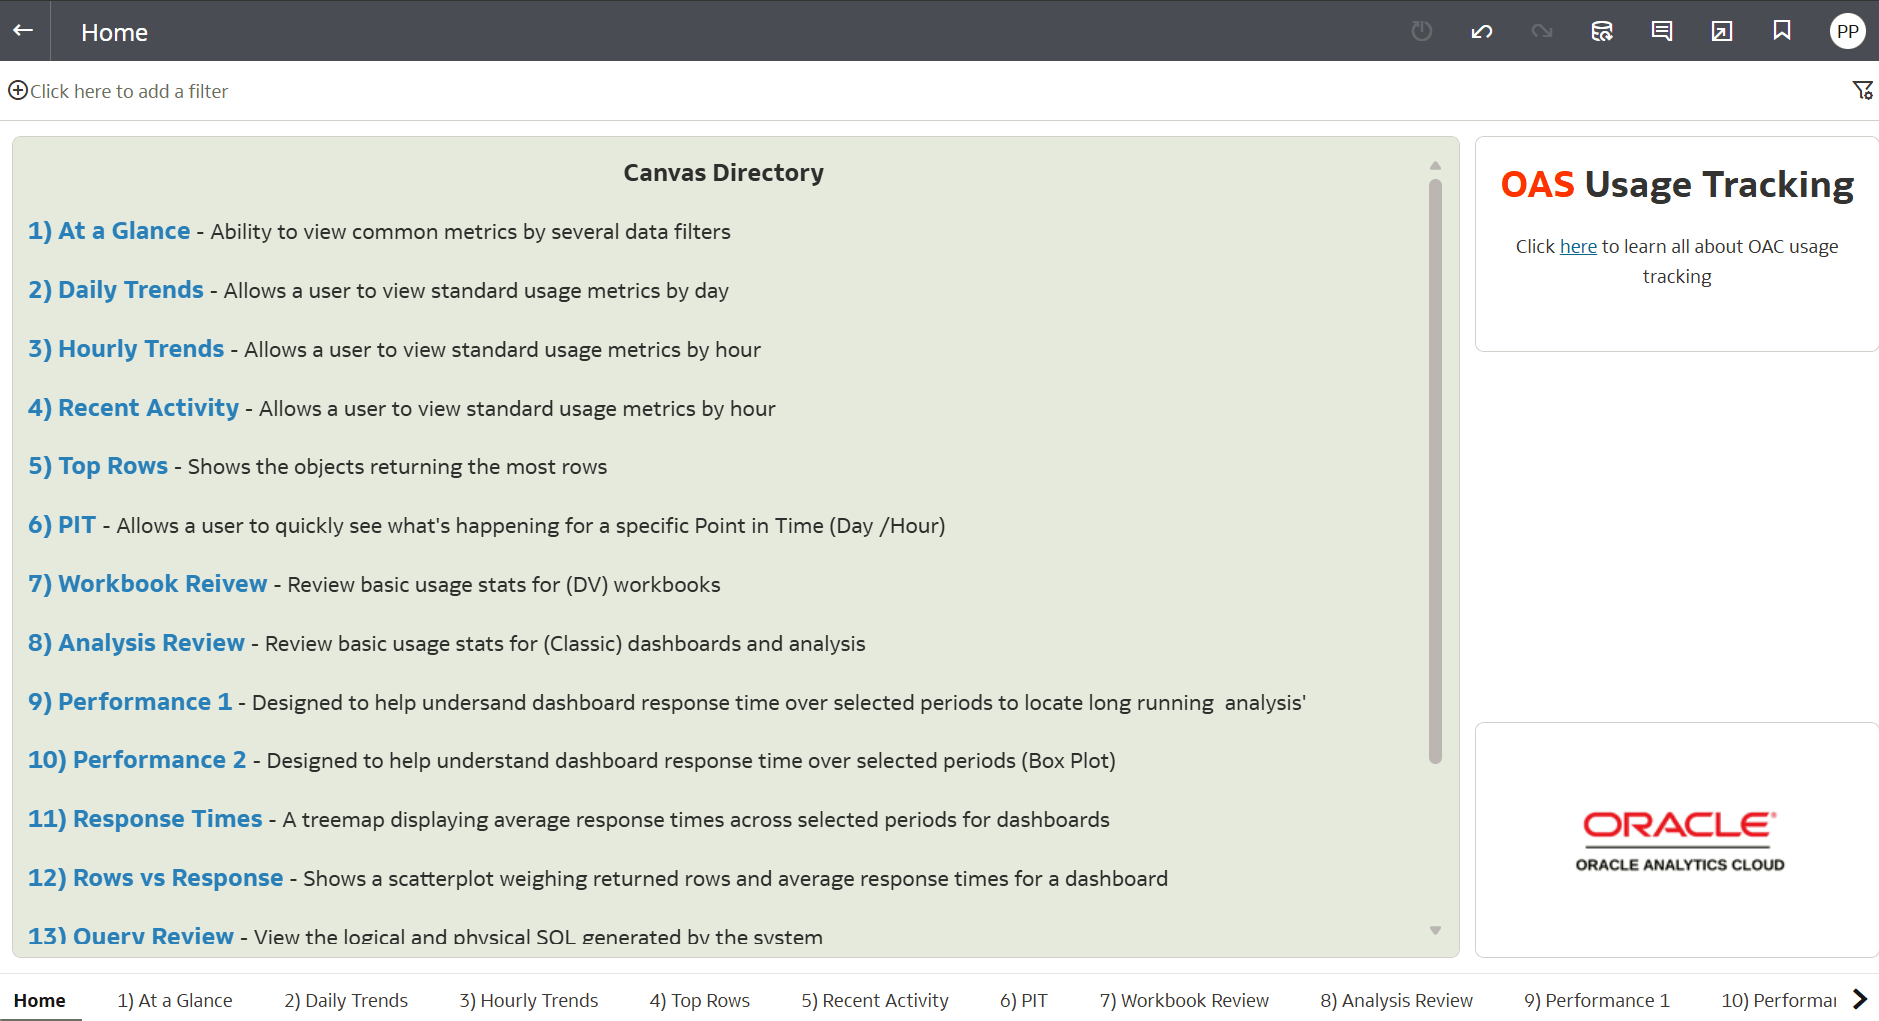
Figure 9-41 Home page
The Canvas Directory lists the available usage analytics pages and describes the purpose of each page.
- At a Glance — View common usage metrics using multiple data filters.
- Daily Trends — Review standard usage metrics by day.
- Hourly Trends — Review standard usage metrics by hour.
- Recent Activity — Review recent usage activity.
- Top Rows — Identify objects returning the highest number of rows.
- PIT — View activity for a specific point in time by day or hour.
- Workbook Review — Review usage statistics for Data Visualization workbooks.
- Analysis Review — Review usage statistics for Classic dashboards and analyses.
- Performance 1 — Analyze dashboard response times and identify long-running analyses.
- Performance 2 — Analyze dashboard response times using a box-plot view.
- Response Times — View average dashboard response times across selected periods.
- Rows vs Response — Compare returned rows with average dashboard response times.
- Query Review — Review logical and physical SQL generated by the system.
The panel on the right displays OAS Usage Tracking and provides a link to additional information about Oracle Analytics Cloud usage tracking.