9.6.1.6 Region
This report enables tracking of Balances, reporting lines, business and performance metrics including comparison with selected regions and regional hierarchy at different levels.
To compare regions using profitability, balances, credit-loss provisions, and closed account activity, open In App Dashboards, select Profitability Insights, and then select PI REGION.
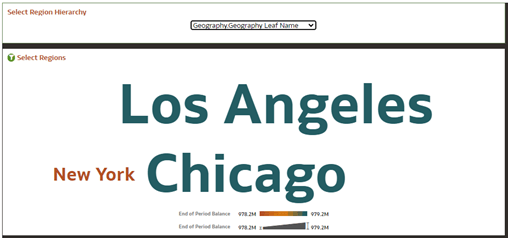
- As-of date:Select the reporting date.
- Levels:Select the geographic hierarchy level to review.
Figure 9-125 Canvas Prompt Filters
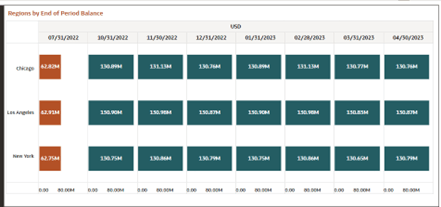
- Regions by End of Period Balance: The chart
displays the End of Period Balances for the region hierarchy or leaf level as
selected by the user.
Figure 9-126 Regions by End of Period Balance
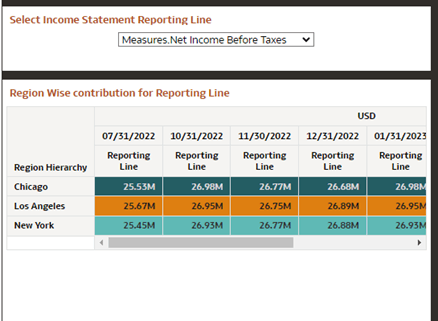
- Region Wise Contribution for Reporting Line:
The chart displays the value of the reporting line for the selected combination
of reporting line, leveraging the Select Income Statement Reporting Line
variable prompt, and region hierarchy, as described earlier in how to leverage
Select Region hierarchy.
Figure 9-127 Region Wise Contribution for Reporting Line
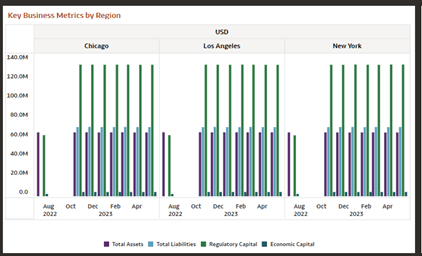
- Key Business Metrics by Region:The chart
displays the key Business Metrics – Total Assets, Total Liabilities, Economic
Capital, and Regulatory Capital for the selected Region hierarchy.
Figure 9-128 Key Business Metrics by Region
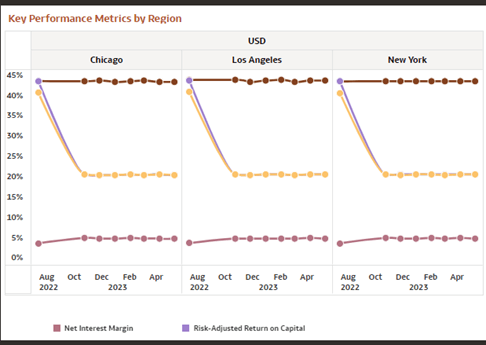
- Key Performance Metrics by Region: The chart
displays the key Business Metrics – Net Interest Margin, Return on Total Assets,
Risk Adjusted Return on Capital, and Return on Equity for the selected Region
hierarchy.
Figure 9-129 Key Performance Metrics by Region
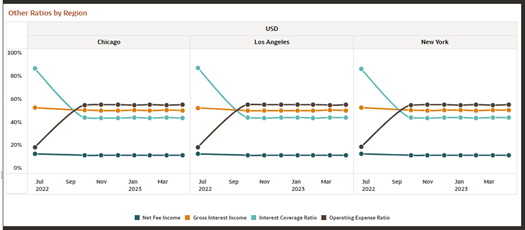
- Other Ratios by Region: The chart displays
business metrics like Net Fee Income, Gross Interest Income, Interest Coverage
Ratio and Debt coverage ratio, all expressed as percentages for the selected
region hierarchy.
Figure 9-130 Other Ratios by Region
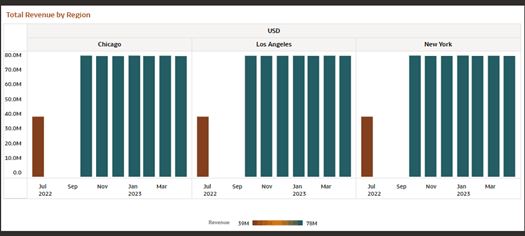
- Total Revenue by Region: The chart displays Total Revenue
for the selected region hierarchy.
Figure 9-131 Total Revenue by Region
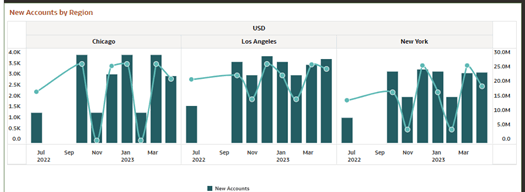
- New Accounts and Closed Accounts by Region: The chart
displays business metrics NIBT, number of New Accounts and Closed Accounts over
time.
Figure 9-132 New Accounts by Region
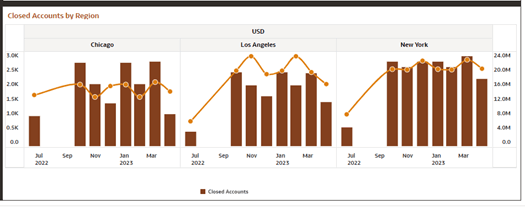
- Closed Accounts byRegion
Figure 9-133 Closed Accounts byRegion
Parent topic: Instrument Level Aggregation and Insights