9.6.1.3 Report Data Action
Figure 9-105 Data Action Configuration in Org Unit canvas
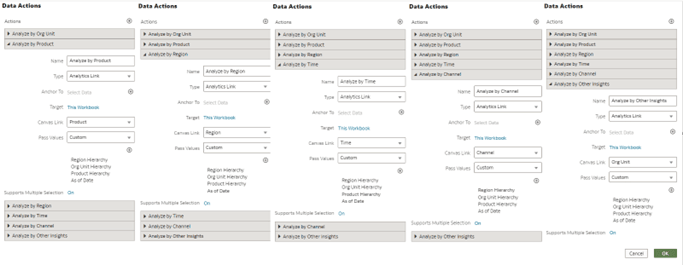
From every chart available in Org Unit you can select a value, and then navigate to the Product, Region and Other Insights canvas.
Figure 9-106 Data Action Configuration in Product canvas
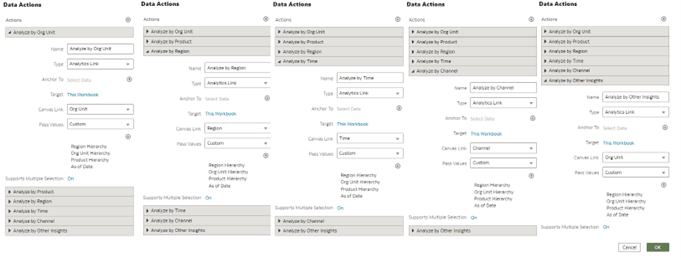
From every chart available in Product you can select a value, and then navigate to the Org Unit, Region and Other Insights canvas.
Figure 9-107 Data Action Configuration in Region canvas
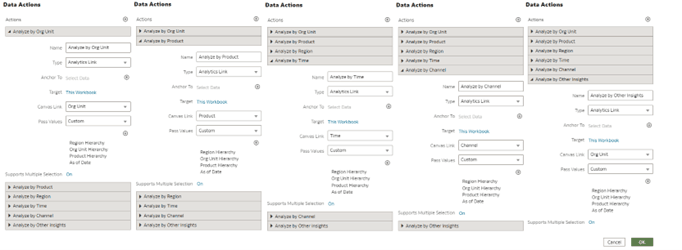
From every chart available in Region, you can select a value, and then navigate to the Org Unit, Product and Other Insights canvas.
Figure 9-108 Data Action Configuration in Time canvas
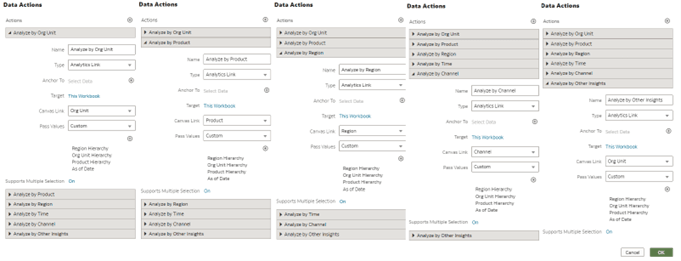
From every chart available in Other Insights, you can select a value, and then navigate to the Org Unit, Product and Region canvas.
Figure 9-109 Data Action Configuration in Channel canvas
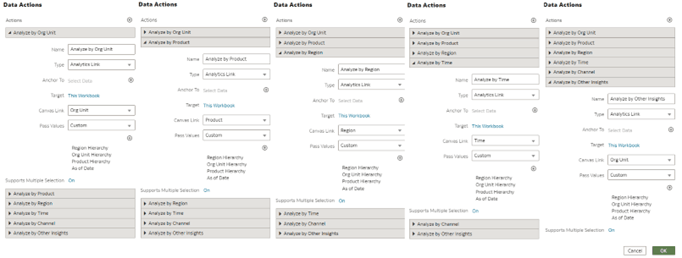
From every chart available in Region, you can select a value, and then navigate to the Org Unit, Product, Region, Time and Other Insights canvas.
Figure 9-110 Data Action Configuration in Other Insights canvas
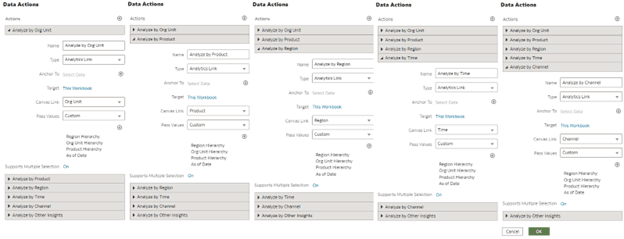
From every chart available in Other Insights, you can select a value, and then navigate to the Org Unit, Product and Region canvas.
In order to do so, with a right click on the chart selection, the data action option (Analyze) will appear for you to be able to pass on the data filters to the canvas that you select.
Parent topic: Instrument Level Aggregation and Insights