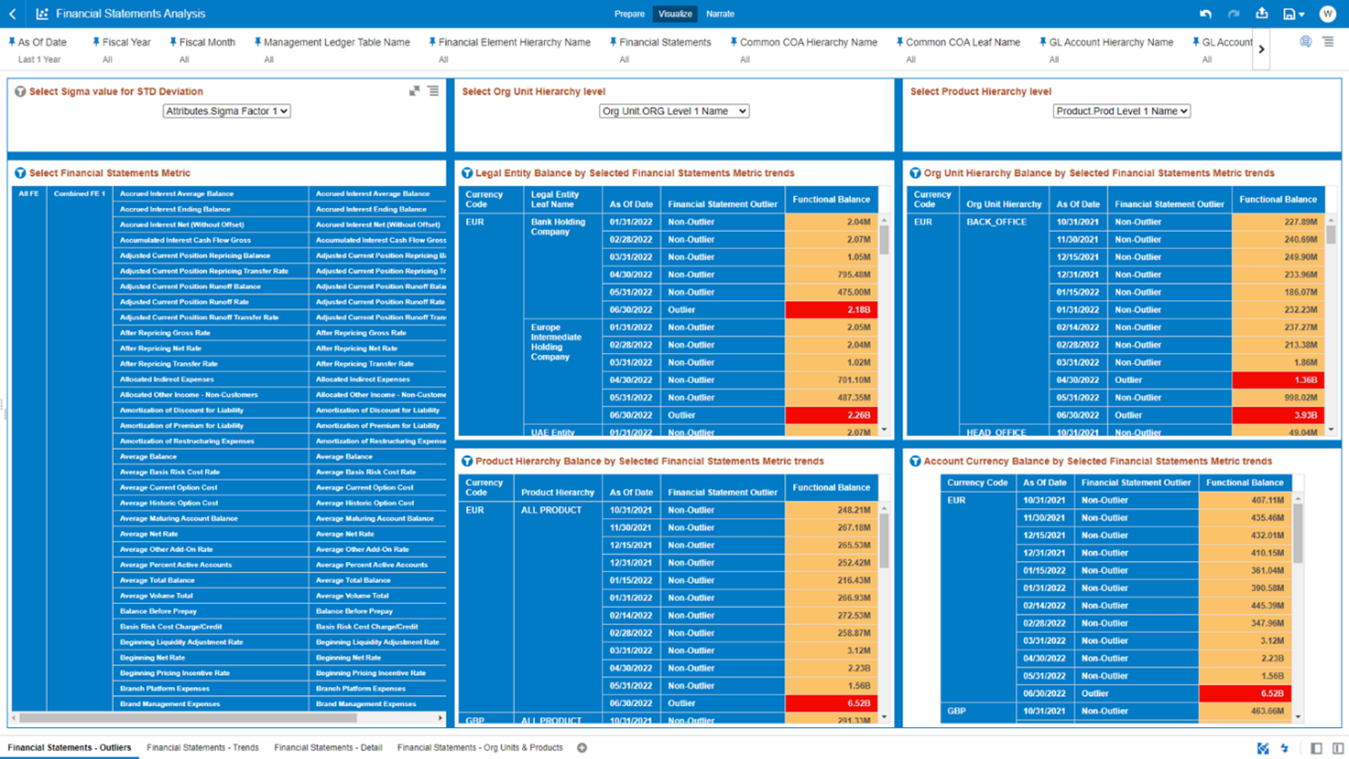
4.1.6.2.4 Financial Statements - Outliers
This canvas allows you to look at the Financial Statements reporting lines outliers that are calculated using the Standard Deviation capability available off the shelf with Oracle Analytics.
The Financial data is segregated between “Outlier” and “Non-Outlier” in the report column “Financial Statement Outlier”.
“Outlier” refers to a Financial data that lies outside the confidence interval of the deviation that we are adopting in our technique.
“Non-Outlier” would refer to a Financial data that lies inside the confidence interval of the deviation.
Figure 4-115 “Financial Statements – Outliers” Report Canvas

A Financial data can be identified as an outlier or a non-outlier based on the standard deviation confidence interval that we adopt.
This Confidence Interval is parametrized with the list of the Sigma values available in the report, that is, “Attributes.Sigma Factor 1”, “Attributes.Sigma Factor 2”, and “Attributes.Sigma Factor 3”.
The Sigma Factors are integer values that range from “Attributes.Sigma Factor 1” to “Attributes.Sigma Factor 3” in the increasing order of the conservativeness or the confidence interval of the Standard Deviation.
This means will have more outliers when you perform analysis with “Attributes.Sigma Factor 1” than with the “Attributes.Sigma Factor 3”.
Figure 4-116 Sigma Factor selection for STD Deviation
