7.1.6.1.1 Multi-Period Analysis
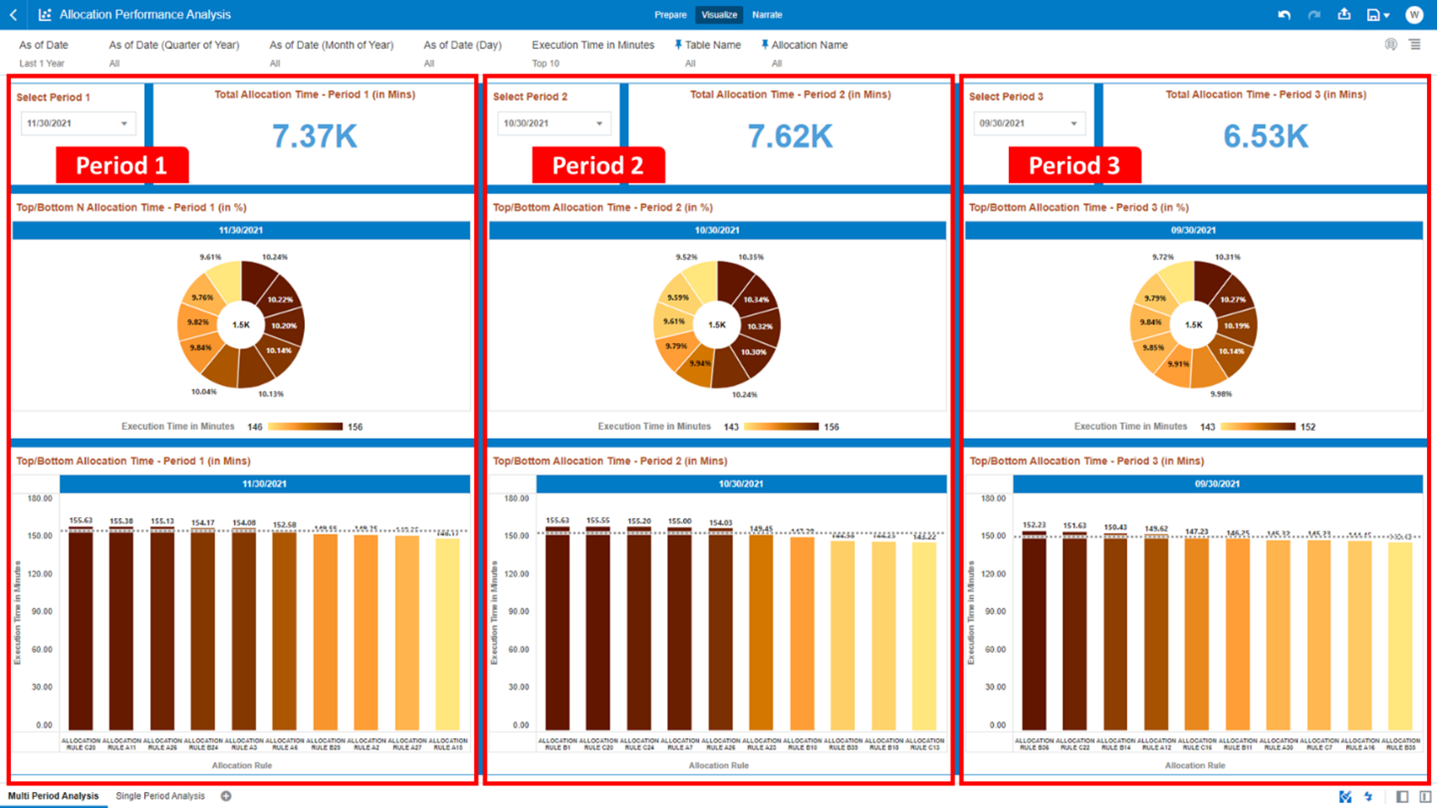
You can use the Multi-Periods Analysis Report section to analyze the Allocation Execution Performances across different periods.
Figure 7-112 Canvas Prompt Filters
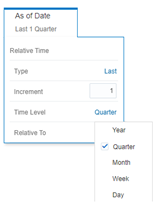
- As of Date: The Execution Period for the Allocation
Rules. You can use this filter to isolate a selected timeframe for the analysis.
The following screenshot displays the possible options that this filter provides
against the Time Dimension.
Figure 7-113 As-of-Date Selection
- Additional Filters for the Time Dimension as follows:
- As of Date (Quarter of Year)
- As of Date (Month of Year)
- As of Date (Day)
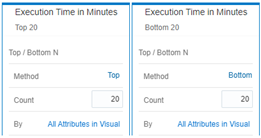
- Execution Time in Minutes: You can use this filter to
retrieve the Top/Bottom N Allocation rules based on their Execution Time in
Minutes.
The possible filter options that you can use are selecting either “Top” or “Bottom” in the “Method” option, as well as define a selected number of occurrences (that is, assigning an integer value such as 5, 10, and so on) in the option “Count”.
Figure 7-114 Execution Time in Minutes for Top/Bottom Selection
- Table Name: You can use this filter to select a specific Table Name (one or more) used by the Allocation Rule that has been utilized for processing.
- Allocation Name: You can use this filter to select a specific Allocation rule (one or more) used by the different process executions.
The first step is to select in the Charts List Box “Select Period 1”, “Select Period 2”, and “Select Period 3”, the three different periods that will be used to compare across different As-of-Date the performances of the Allocation Rules executed.
The first screenshot shows how to select the First Period, and the subsequent screenshots show how to select the Second and Third Periods. <Enter a single subject here.>
Figure 7-115 Select Period 1 for the Allocation Rules Execution
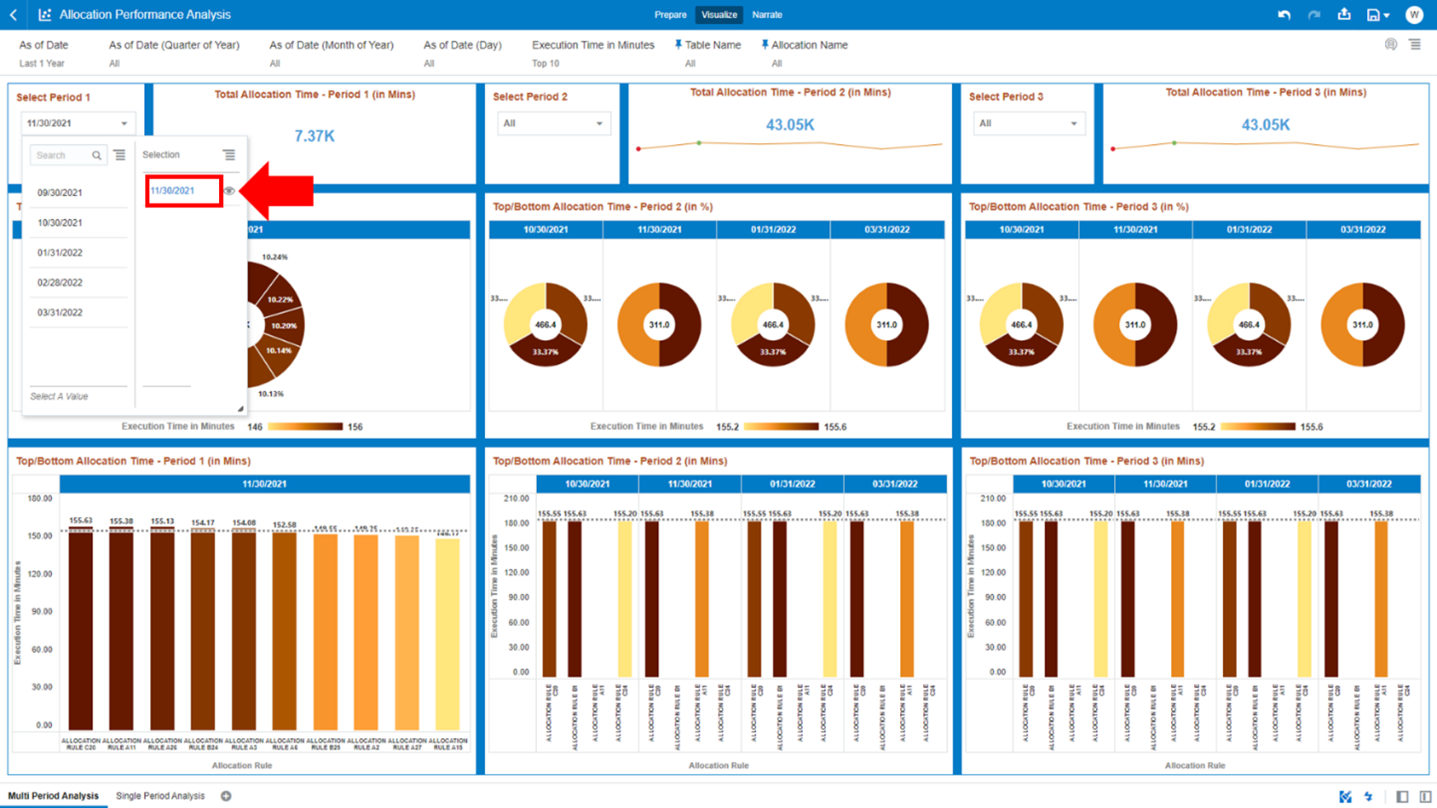
Figure 7-116 Select Period 2 for the Allocation Rules Execution
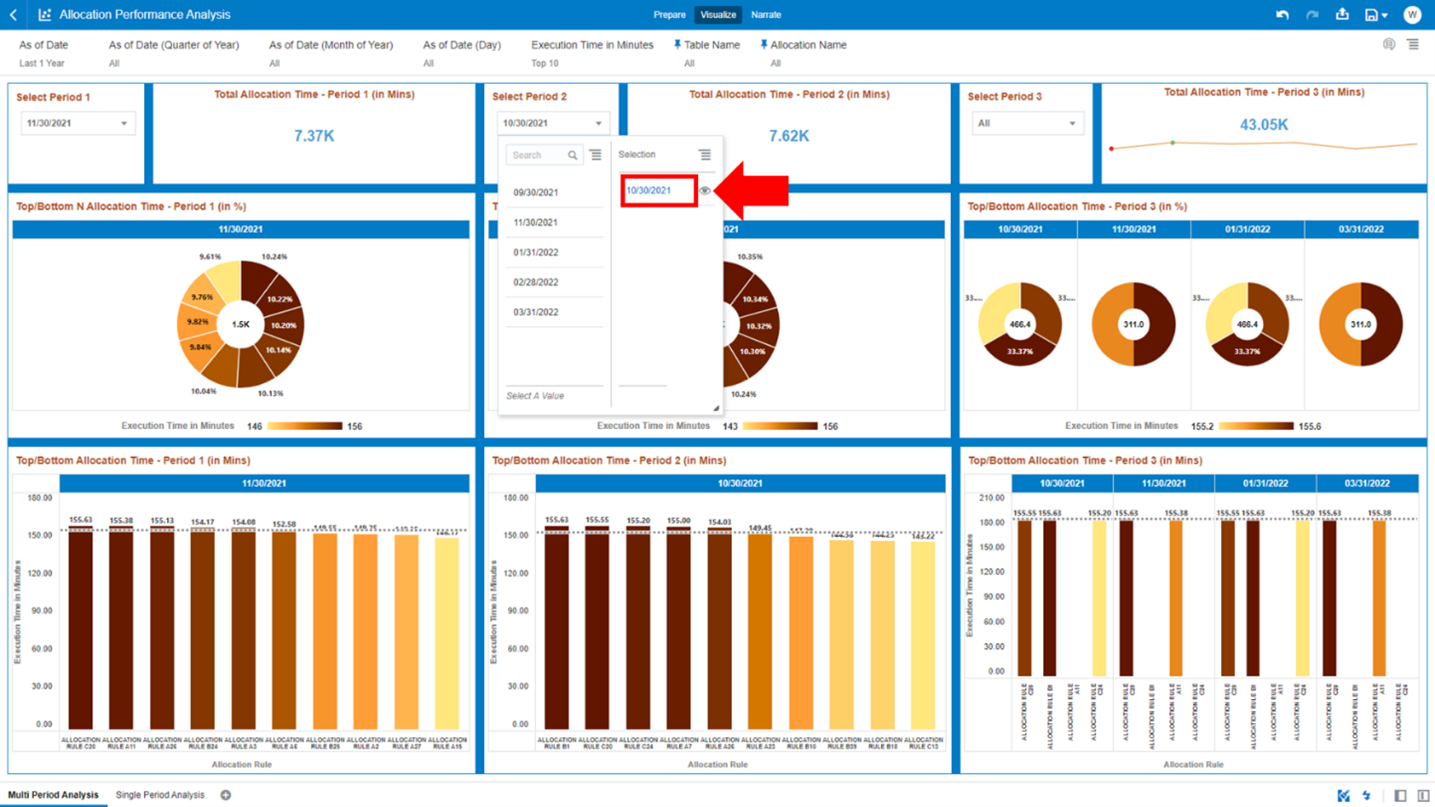
Figure 7-117 Select Period 3 for the Allocation Rules Execution
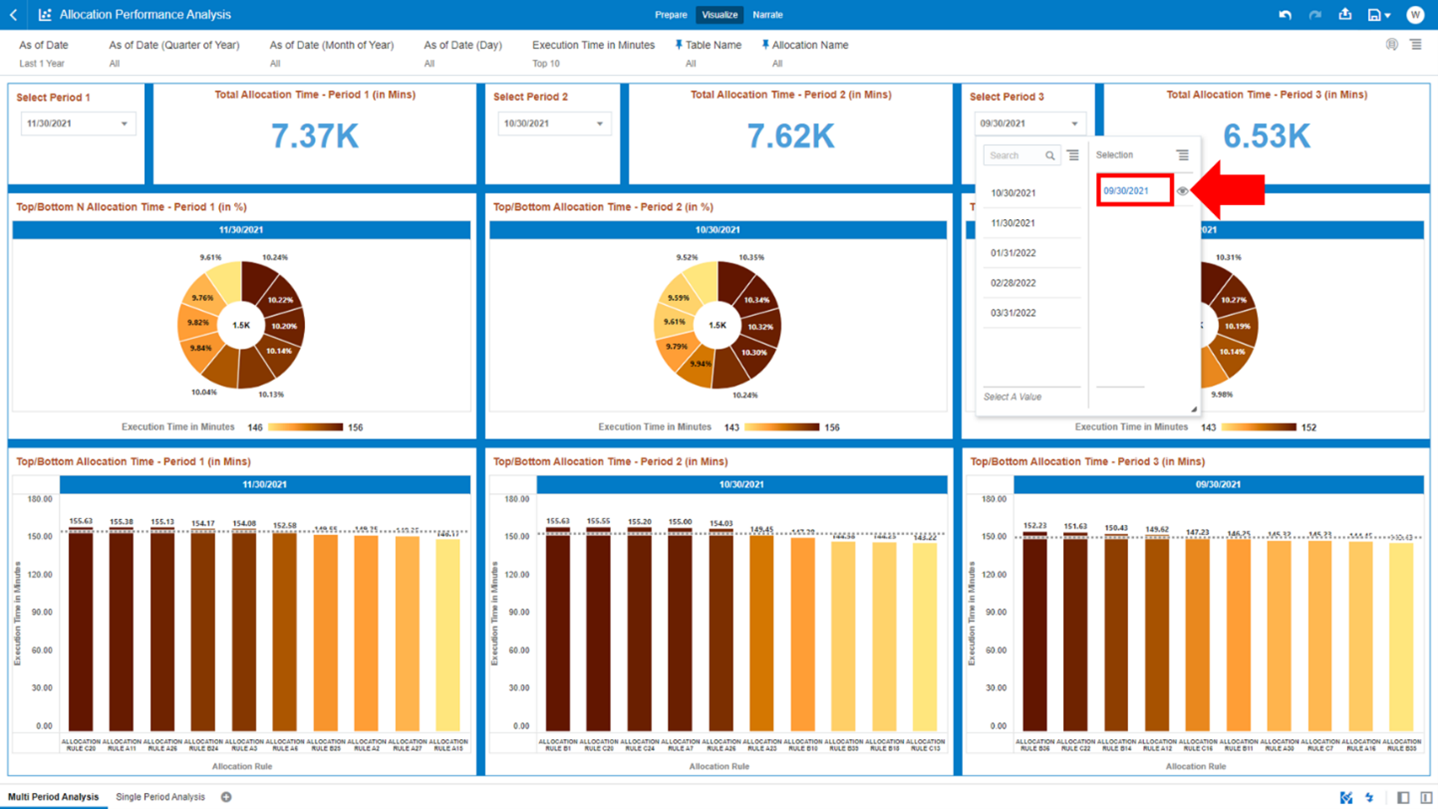
The result of the three previous selection steps is shown in the following screenshot. You can compare the multiple periods and analyze the performances across them.
The report displays the underlying data according to the following charts’ logic and for the three sections Period 1, Period 2, and Period 3 (the charts description will reference only the “Period 1” as for the other periods the content will be functionally the same):
- Select Period 1 (2 or 3)
The As-of-Date selected for the Period that you want to analyze.
- Total Allocation Time - Period 1 (2 or 3) (in Mins) – (Tile Chart)
The total time spent in minutes for all the Allocation Rules executed during the selected period.
- • Top/Bottom N Allocation Time - Period 1 (2 or 3) (in %) – (Pie Chart)
The chart displays the N Allocation Rules, out of the Top/Bottom N selection (where N is related to the value used in the Report Prompts Filter selection on the “Execution Time in Minutes”; in the screenshot for example we have filtered “Top 10”), sorted by the Allocation Rule Percentage Value.
The Percentage Value, is calculated based on the “Execution Time in Minutes” spent for the Allocation Rule, out of the total time spent for the Top/Bottom N Allocation Rules selected.
In the following, we see, for instance, what is the Allocation Rule that needed more time to be executed and that is the one scoring a higher percentage value out of the total time spent within the Top/Bottom N selection.Figure 7-118 Top/Bottom N Allocation Time – Period 1 (in %)
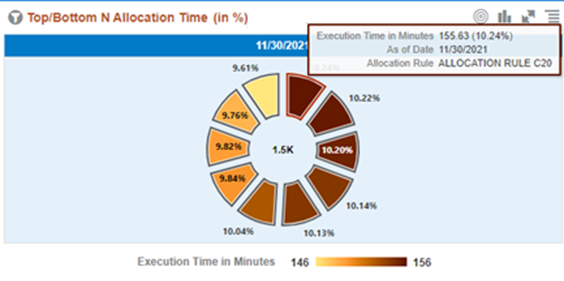
The chart also displays the “Execution Time in Minutes” needed by the Top/Bottom N Allocation Rules (this value is visible at the center of the above pie chart screenshot and in this example is “1.5K” minutes).
- Top/Bottom Allocation Time - Period 1 (2 or 3) (in Mins) – (Bar Chart)
The chart displays the N Allocation Rules, out of the Top/Bottom N selection, sorted by the “Execution Time in Minutes” in descending order.
Figure 7-119 Allocation Performance Analysis – Multi Period Analysis
