7.1.7.2.4.2 Use Case Flow for Outliers Analysis

You can refer this use case to best leverage the advanced analytics capabilities of the reports.

Starting from the canvas “Financial Statements – Outliers” you can perform a series of actions as following described.
  1. Select your desired Sigma value on which the outlier analysis will be generated.

    Figure 7-159 Sigma Value Selection


    Select your desired Sigma value on which the outlier analysis will be generated.

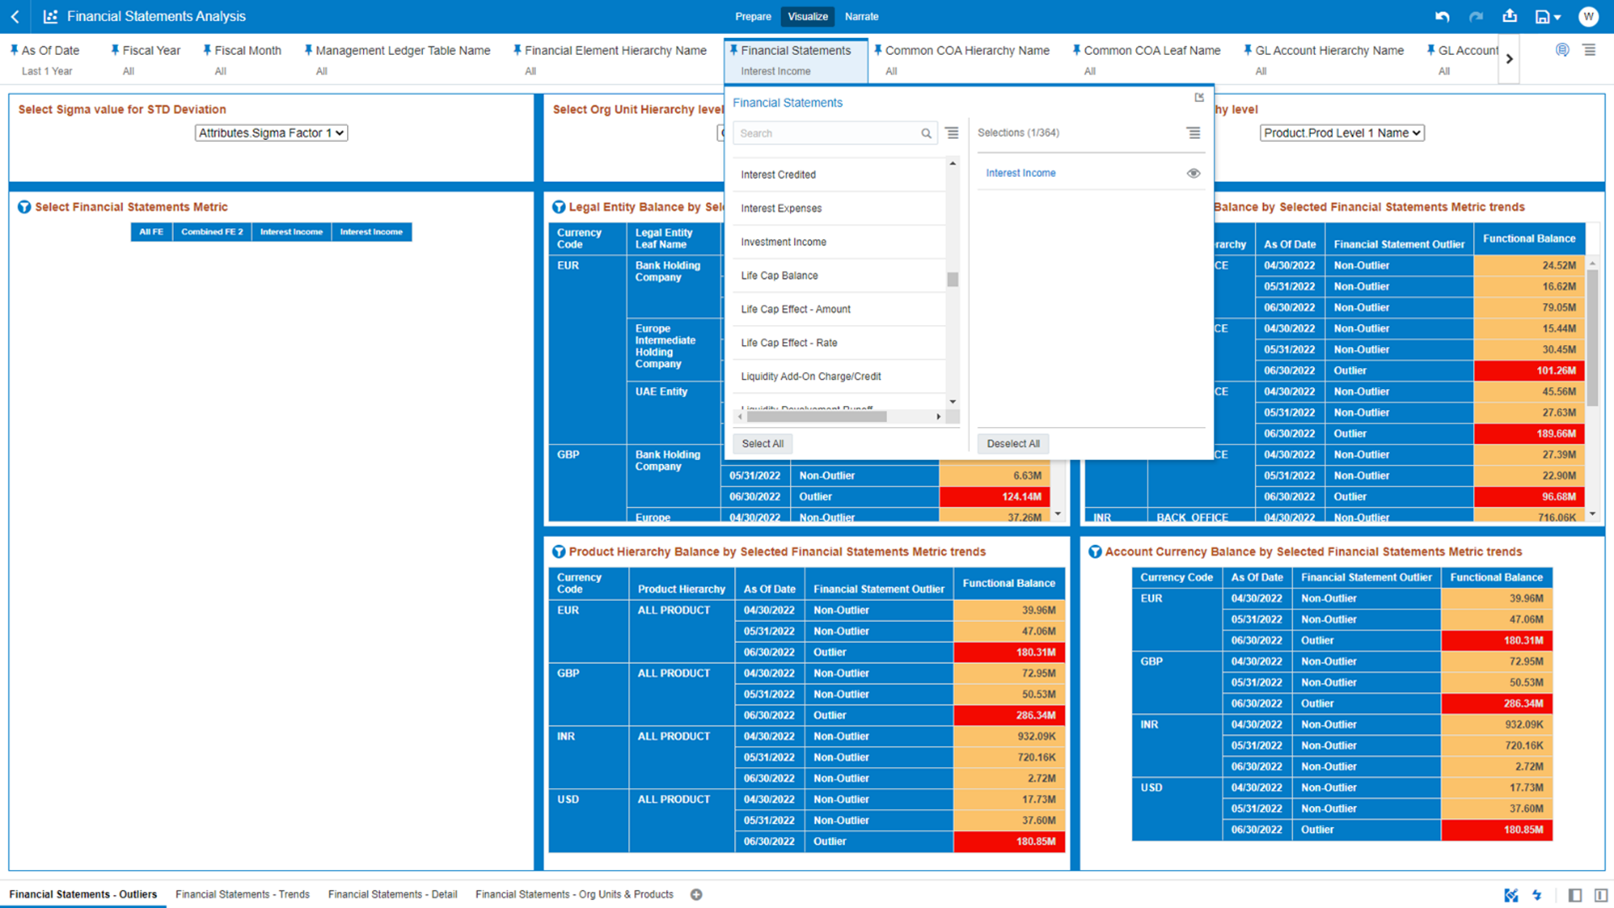
  2. Select the Financial Statements, as described in the previous section Working with Financial Statement Reporting Lines.

    Figure 7-160 Financial Statements Selection


    Financial Statements Selection

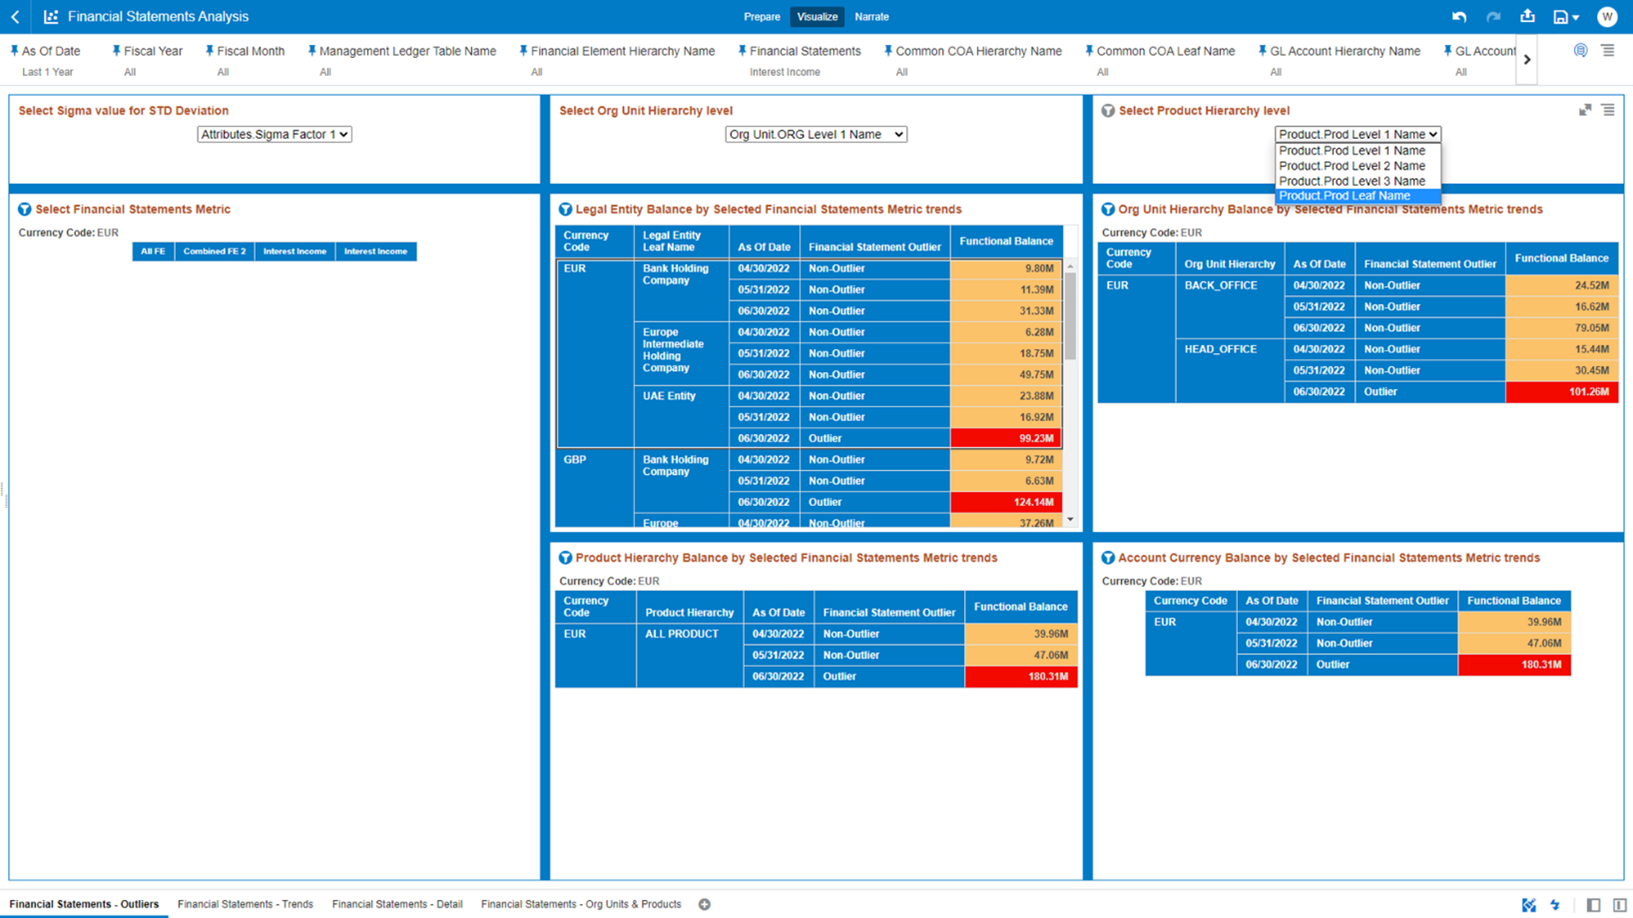
  3. Select the Outliers and change the desired Hierarchy level for any of the available Key Processing Dimensions.

    Figure 7-161 Outliers Selection


    Select the Outliers and change the desired Hierarchy level for any of the available Key Processing Dimensions.

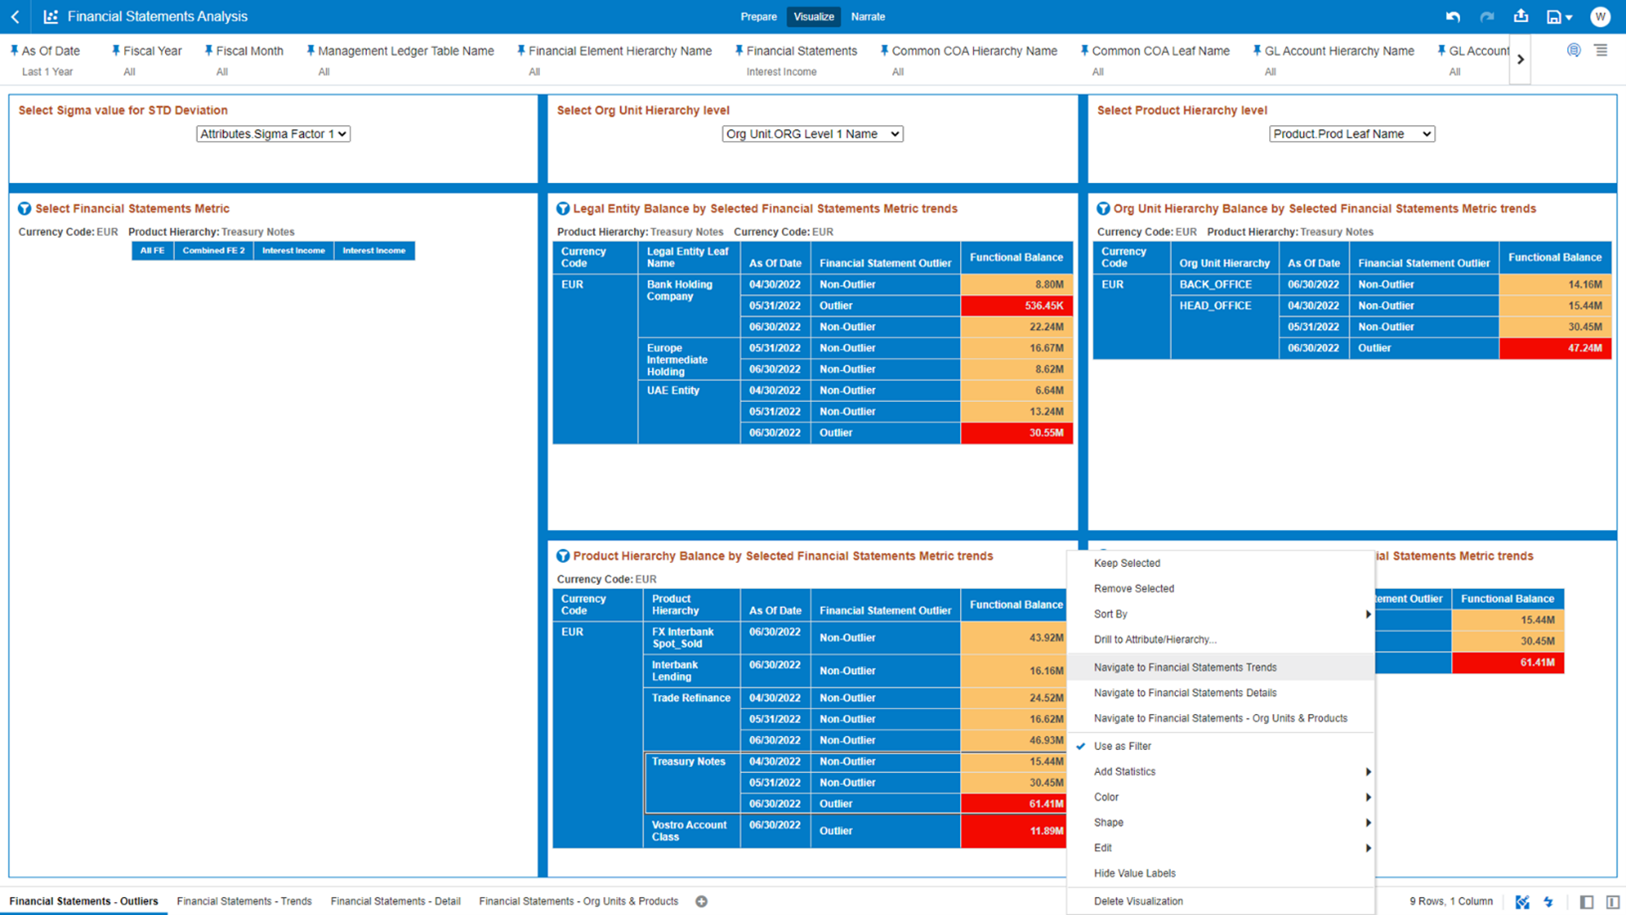
  4. After you have selected a combination of outliers and related Dimensions, you can use the Data Actions to navigate to the other Report Canvases.

    Figure 7-162 Navigation to Report Canvases


    After you have selected a combination of outliers and related Dimensions, you can use the Data Actions to navigate to the other Report Canvases.