3.6 Data Verification
The Data Verification UI helps you to verify the data that is loaded from the source systems to the Cloud Service’s stage and processing tables, make minor corrections/adjustment to the data, and add new data directly into the tables. This UI allows you to add one record at a time and is not recommended for high volume additions as entering data is a lengthy process.
To open the Data Verification screen, from the LHS menu, select Data Management Tool, and then select Data Verification.
Figure 3-19 Data Verification Dashboard

This screen displays two tabs namely Staging and Processing. The Staging tab displays the tables that are in the staging level where you can select a table, see the data, carry out corrections, or add new data. The Processing tab displays the tables that are at the processing level and you can do all the actions similar to Staging tables.
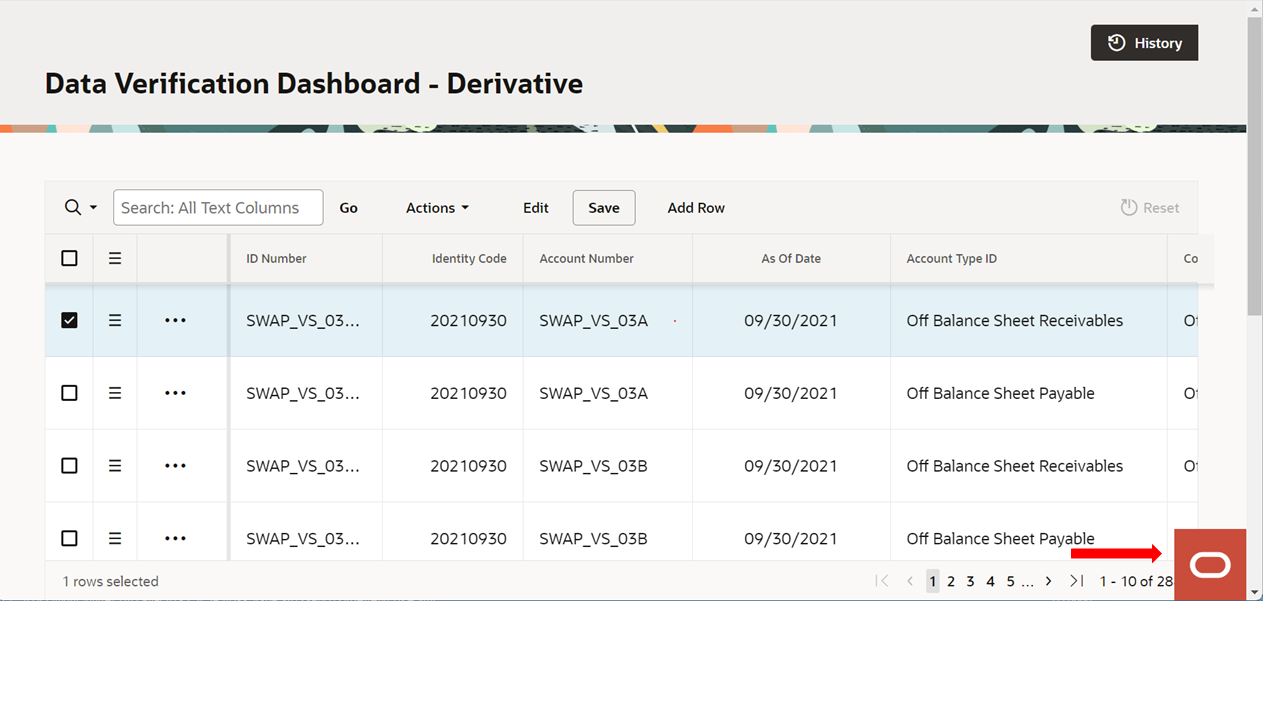
When you select a table, a new window is displayed with a grid where you can see the selected columns.
Figure 3-20 Data Verification – Stage Asset (sample Staging table)

Navigating through Data Verification
Figure 3-21 Navigation through Data Verification

Users and Roles
The following roles and functions are required to use the Data Verification UI, edits the data, and add data to the Stage and Processing tables.
Table 3-18 Roles and Role Names
| Role | Role Name |
|---|---|
| RLGADMACC | Data Management Access |
| RLGADMWRITE | Data Management Write |
| RLGADMREAD | Data Management Read Only |
| RLGADMPASRN | Data Management PA Access |
The access to the users can be restricted up to table level because all the users need not have access to all the tables.
Add a New Record
To add a new record to a selected stage/processing table, click Add Row. Enter/populate the mandatory and the relevant columns and then click Save. When you click Add Row, you must enter the mandatory key columns first, and then click ellipsis (…) icon. After this your can click the ellipsis (…) icon to open the Edit Table window, fill the relevant details and then save the details.
Delete a Row
To delete a row, select the row and click the hamburger icon to collapse the menu where you can select Delete Row.
Duplicate a Row
You can select a row and click Duplicate Row from the hamburger menu. This creates duplicate row with the same values in the Data Verification - <Table> screen.
Edit a Record
To edit a record, select a row from the Data Verification window. There are two ways in which you can edit the columns from the table.
- Select a row from the Data Verification grid and click the Edit button. This enables the columns that are exposed. You can double-click the entry to edit. Editing the key columns in the table is restricted.
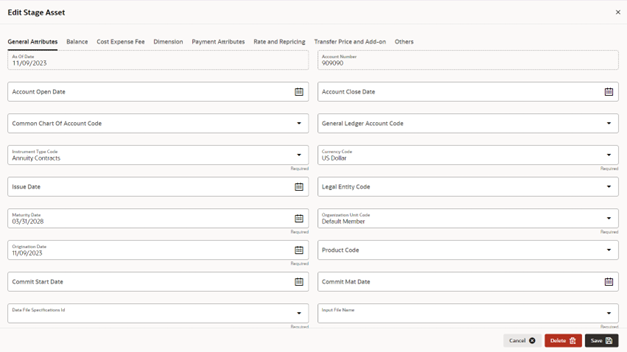
- Select a row from the Data Verification grid and click the ellipsis (…) icon, and then click Edit. This opens the Edit Table window. This window displays all the columns from the table. The columns are categorized based on their nature and displayed in different tabs. You can select the relevant columns and edit. After you update the relevant details, click Save.
Figure 3-22 Sample Edit Table

Actions Menu
The Actions menu displays a list of actions that you can perform on a selected record. Few actions are explained below:
- Columns: This displays the Columns window where you reorder the displayed columns, remove form display columns that you don’t want to be displayed. If you don’t want to display a particular column, select the check-box against the column name, and then click Save.
- Filter: This helps you to set a criterion to search a
particular record.
You can also set a filter by selecting the Search button on the top-left-corner of the grid. This collapses list of all the columns in the selected table. You can select a column and filter the records based on it.
- Data: Displays sorting options.
- Format: From here, you can set the number of rows per page to be displayed.
- Report: This option allows you to generate and save a report.
View History
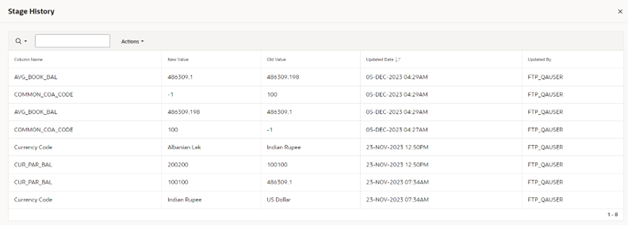
This option displays the changes carried out on a selected record. To see the history on a record, select the record, click the ellipsis (…) icon, and then select View History. This displays the history of updates on the selected record with details such as Column Name, New Value, Old Value, Updated Date, and Updated By.
Figure 3-23 History at Record Level

To navigate back to the Dashboard or the selected table’s Data Verification screen, you can click on the O logo at the right-bottom corner, and then select Dashboard on the next screen. You can also type the table name for a quick search.
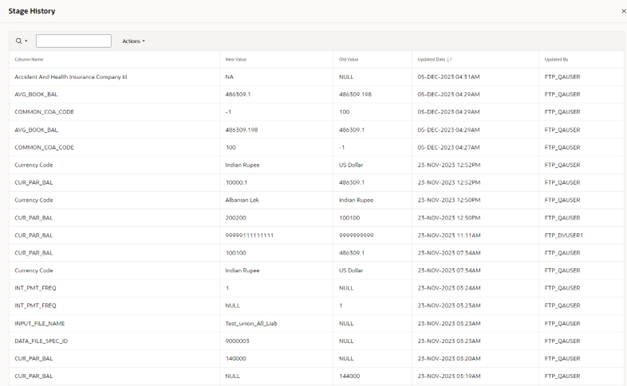
To see the history of all the records on a particular table, select the record and click the History button on the top right-hand corner of the screen. This displays all the updates done on the all the records in the table. A sample screen of the history on the table is as follows:
Figure 3-24 History at Table Level
