7.1.8.2.5 Financial Statements - Trends
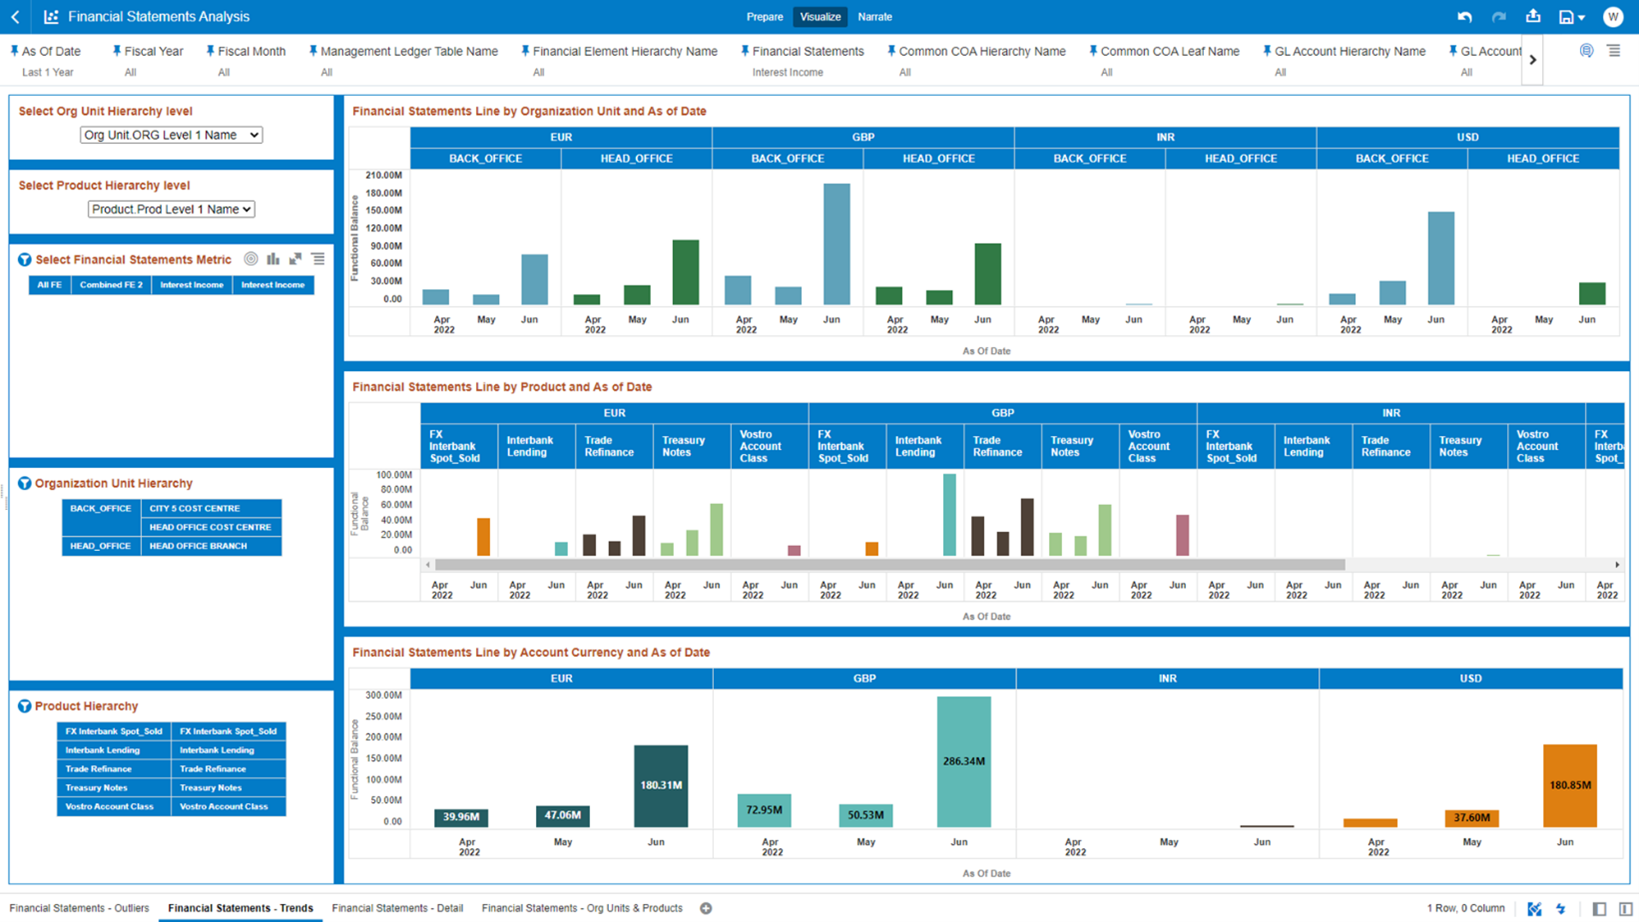
The “Financial Statements – Trends” Report describes the trend of the Financial Statements reporting lines with respect to As-of-Date.
You can use a series of Report Prompts, as previously described, to filter the data according to key attributes pertaining to the underlying Management Ledger data.
As described in the previous section Working with Financial Statement Reporting Lines, to perform a correct
analysis, you should select a single FE Reporting Line that you want to use for your
analysis. The report displays the underlying data according to the following Charts’
logic:

- Select Org Unit Hierarchy level: The chart provides you with a selection capability for the desired Org Unit Hierarchical level.
- Select Product Hierarchy level: The chart provides you with a selection capability for the desired Product Hierarchical level.
- Select Financial Statements Metric: The chart provides
you with a selection capability for the desired Financial Element reporting
line. The Financial Element Leaf Name is the actual data on which the reporting
is based whereas the chart provides with the parent levels for ease of finding
out the Financial Element Leaf member.
The columns displayed in the chart are the following:
- Financial Element Level 1 Name
- Financial Element Level 2 Name
- Financial Element Level 3 Name
- Financial Element Leaf Name
- Organization Unit Hierarchy: The chart provides you with two levels of the hierarchy – the selected level from the “Select Org Unit Hierarchy level” as well as the Org Unit leaf nodes. You use this chart to further filter down the “Financial Statements – Trends” charts.
- Product Hierarchy: The chart provides you with two levels of the hierarchy – the selected level from the “Select Product Hierarchy level” as well as the Product leaf nodes. You use this chart to further filter down the “Financial Statements – Trends” charts.
- Financial Statements Line by Organization Unit and
As-of-Date: The chart reports the trend analysis of the
Financial Statements reporting lines with respect to As-of-Date and it is split
by Currency and Org Unit (the Org Unit display is based on the Org Unit
Hierarchy level you’re analyzing).
The columns displayed in the chart are the following:
- Currency Code
- Org Unit Hierarchy
- As Of Date
- Functional Balance
- Financial Statements Line by Product and As-of-Date: The
chart reports the trend analysis of the Financial Statements reporting lines
with respect to As-of-Date and it is split by Currency and Product (the Product
display is based on the Product Hierarchy level you’re analyzing).
The columns displayed in the chart are the following:
- Currency Code
- Product Hierarchy
- As Of Date
- Functional Balance
- Financial Statements Line by Account Currency and
As-of-Date: The chart reports the trend analysis of the
Financial Statements reporting lines with respect to As-of-Date and it is split
further by Currency.
The columns displayed in the chart are the following:
- Currency Code
- As Of Date
- Functional Balance
Figure 7-172 “Financial Statements – Trends” Report
