3.3.2 Grid View
You can select the thumb view ![]() icon to view the Queue List for All Teams in Grid View.
icon to view the Queue List for All Teams in Grid View.
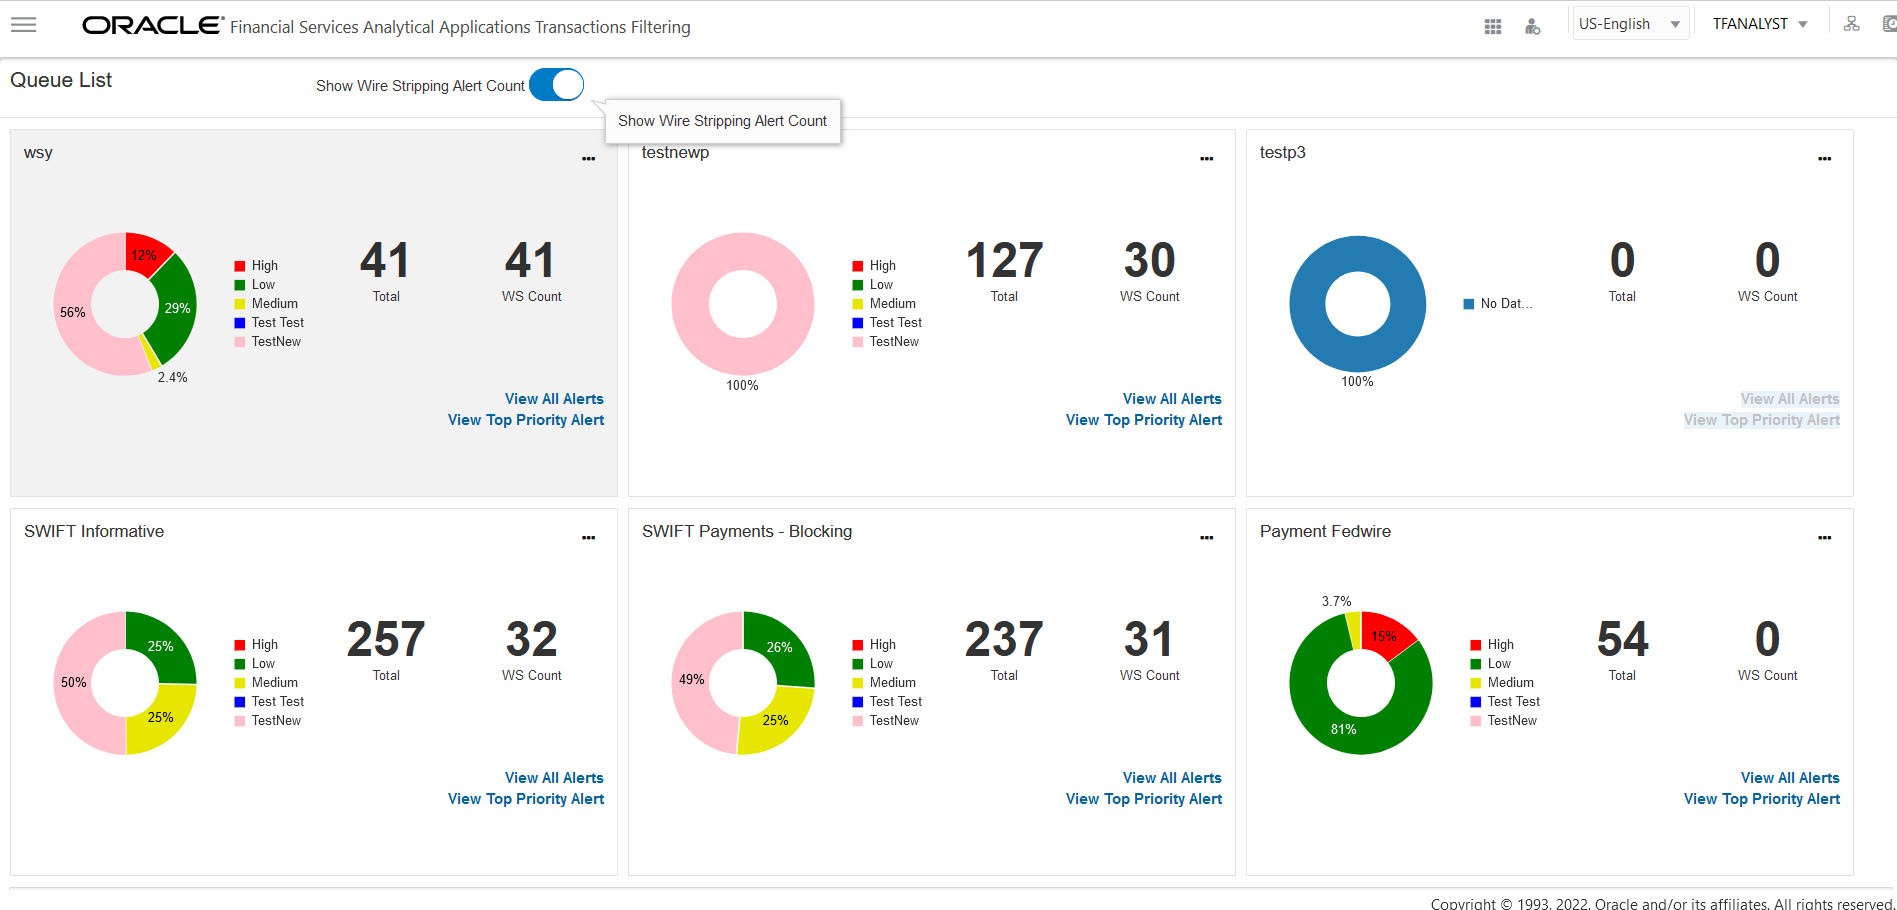
Figure 3-8 Queue List in Grid View with WS Alert Count
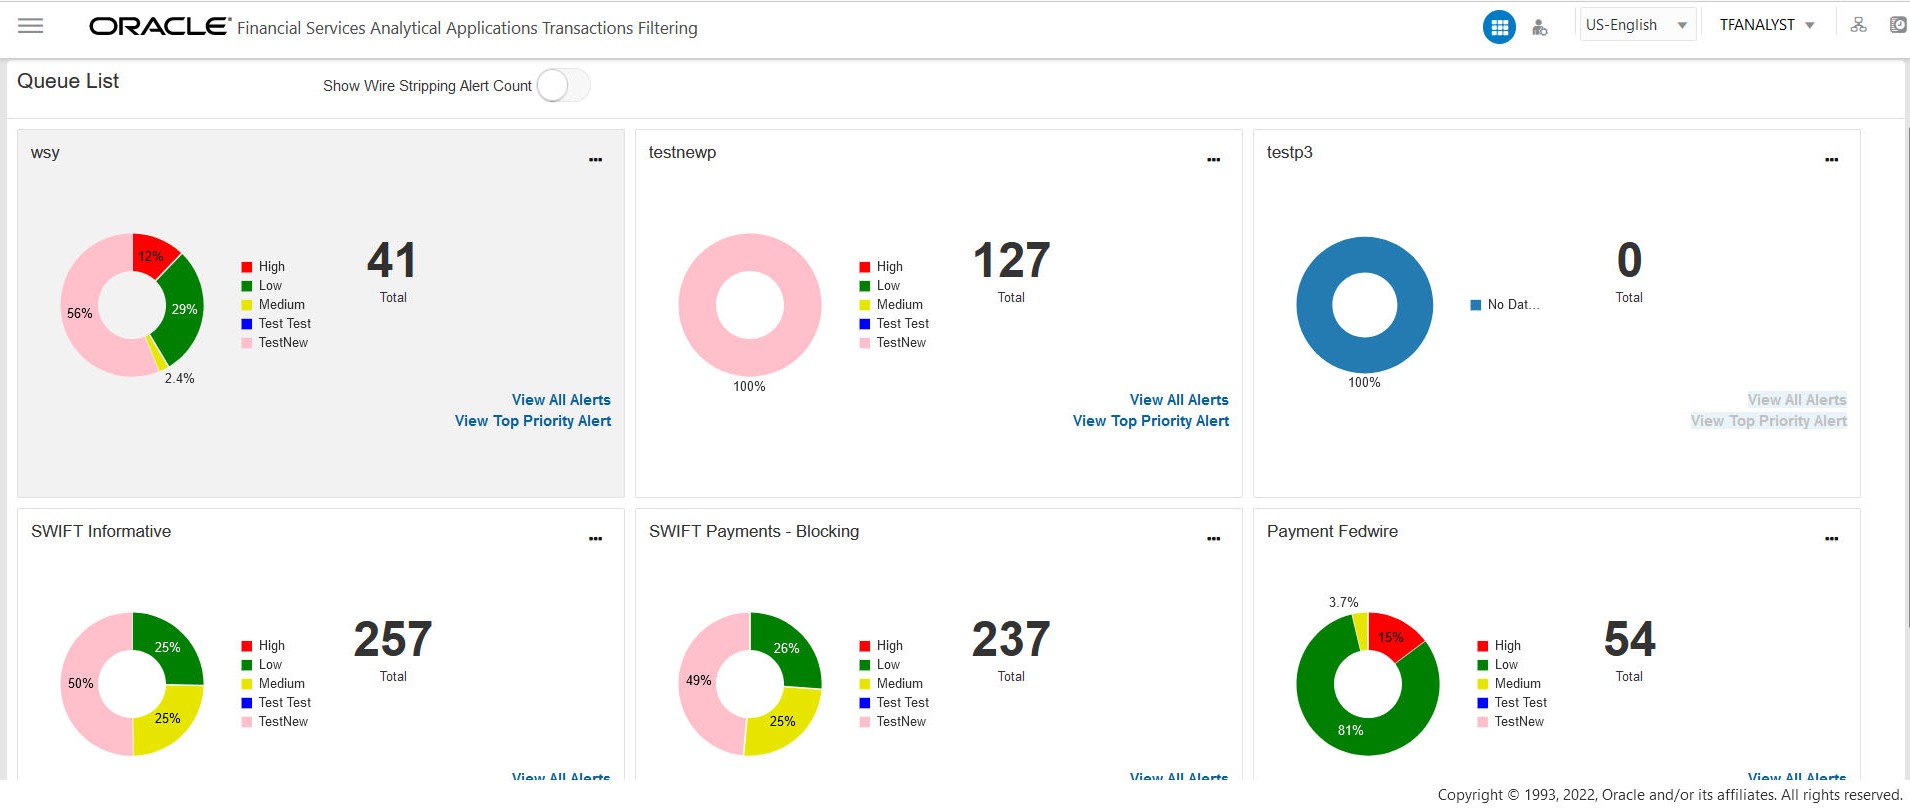
The Queue List appears in doughnut charts displays each cell's data as a slice of a doughnut. A pie chart data visualization uses a single circle divided into slices, each slice representing a numerical proportion of the whole circle's value. Hover over the slices to see the details of the Series and the Value of the queue.
By default, the color-coding displayed for three priorities of the alerts and the Total numeric value indicates the number of alerts in that Queue.
The following are the default priorities in the application:
- High
- Medium
- Low
An admin can configure any number of priorities and color code that needs to be displayed on the Queue Management Dashboard against each of the priority based on their requirement in the backend based on the match score, screening type, event type, jurisdiction and business domain.
The Queue Management dashboard displays all the priorities defined by the admin and the number of alerts meeting the priority condition. If there are alerts which doesn't fall under any priority criteria are displayed as No Priority Set.
Priority configuration for all the alerts to be defined before transaction filtering.
You can view six queues in Queue List and use the navigation to view the next set of queues.
Queue Admin can assign one Queue to multiple User Groups and multiple Queues to one User Group.
For example, the 4 queues are in the following priority:
- 1 - Sanctions Queue
- 2 - Prohibition Queue
- 3 - PEP Queue
- 4 - EDD Queue
Once all the alerts in the Sanctions queue are investigated, when user navigates to the next alert, then the user will automatically pick up the alerts from the next most prioritized queue, which is Prohibition Queue.
While the user is working on Prohibition Queue and navigates to next alert, if in case any new alerts gets generated in the highest priority queue, which is Sanctions Queue, then the user will get the alerts from the Sanctions Queue.
Note:
- The above scenario is applicable for Analyst and Supervisor roles only. Senior supervisor can access alerts from any queue.
- As an Analyst or Supervisor user, he/she should be able to access a specific alert across the Queues, (based on the security attributes) to make a decision and come back to the Alert List page, where all the alerts in the queue(s) are listed.
- A Reviewer user can access and view all the alerts from any queue.
You can perform the following actions on each queue:
- Open: Click the Ellipsis menu and then select Open to open the queue to see alerts inside the Queue. It is the same as View All. For more information on Managing Alerts, see the Alert List section.
- View All Alerts: Select View All Alerts to see the list of alerts in the Queue. For more information on Managing Alerts, see the Alert List section.
- View Top Priority Alert: Select View Priority Alert to see the alert details based on their priority. You can navigate to the next alert using the Get Next icon in the top right corner. For more information about Alert details, see the Alert Details section.

