Navigating Reporting and Analytics
Explore the dashboard layout and report features.
Home Page
My Reports is your home page in Reporting and Analytics.
Dashboard
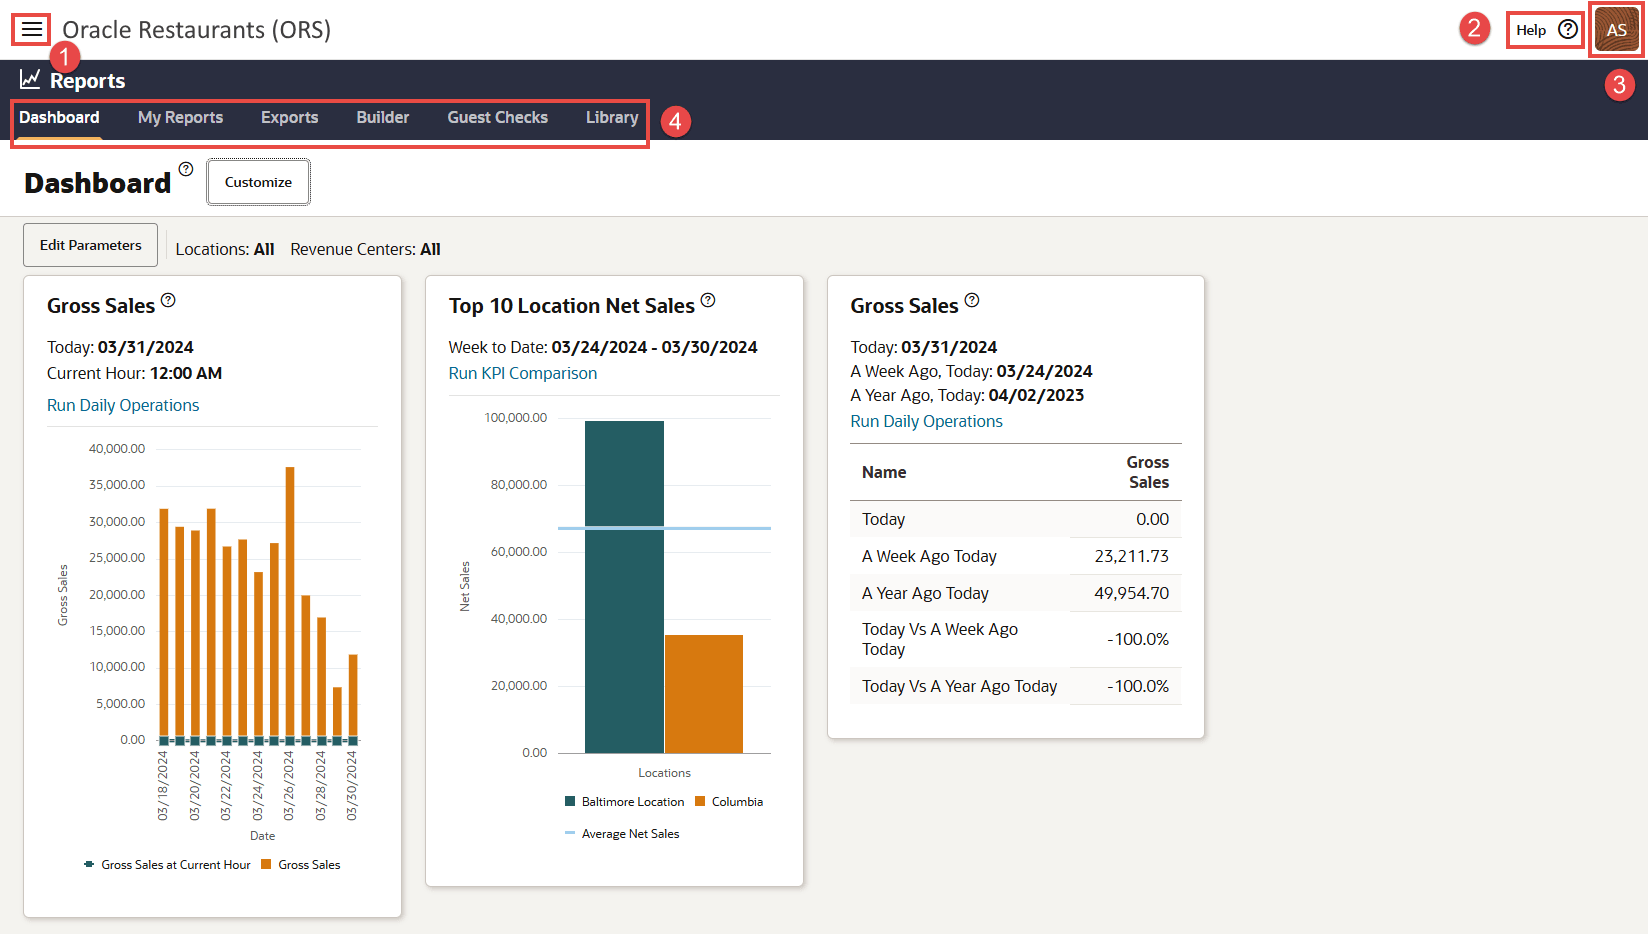
Elements on the dashboard are called out by number in the table and correspond to the image. These elements are anchored and appear on every page within Reporting and Analytics.
| Callout Number | Element | What It’s Used For |
|---|---|---|
|
1 |
Side navigation menu |
Navigate between reports, administration features, and portlets. |
|
2 |
Help |
Hover over or click the icon wherever it appears to find out more information. |
|
3 |
Your menu |
View profile or sign out. |
|
4 |
Reports navigation |
Access report features. |

Reports
All available reports are housed in the Reporting and Analytics Library tab and you can create new reports in the Builder tab. You can easily access the reports that are most useful to you in the My Reports tab.
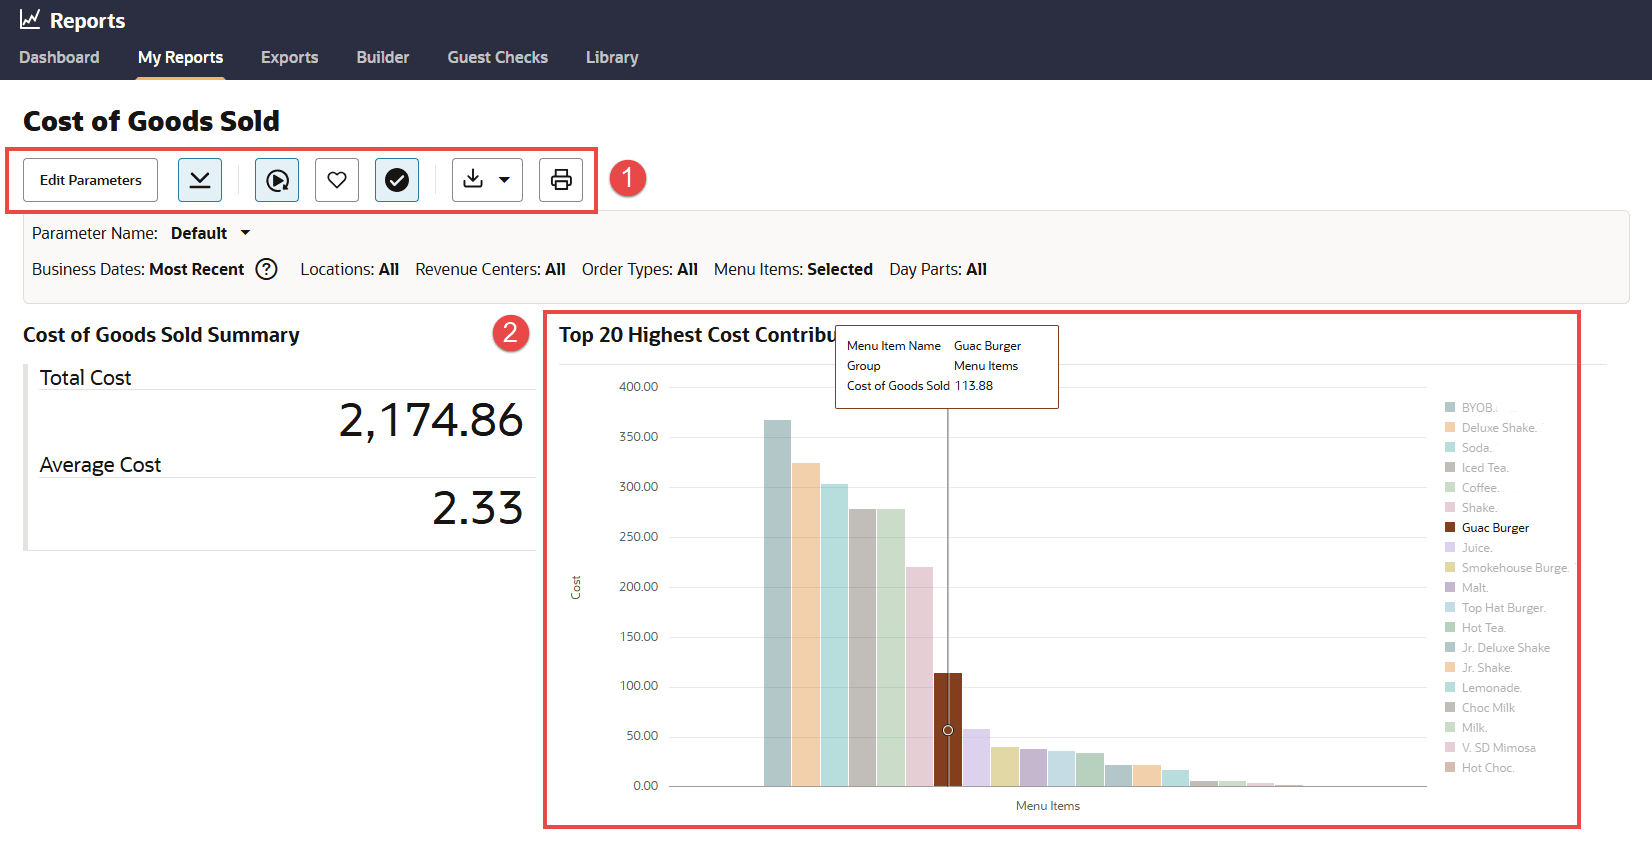
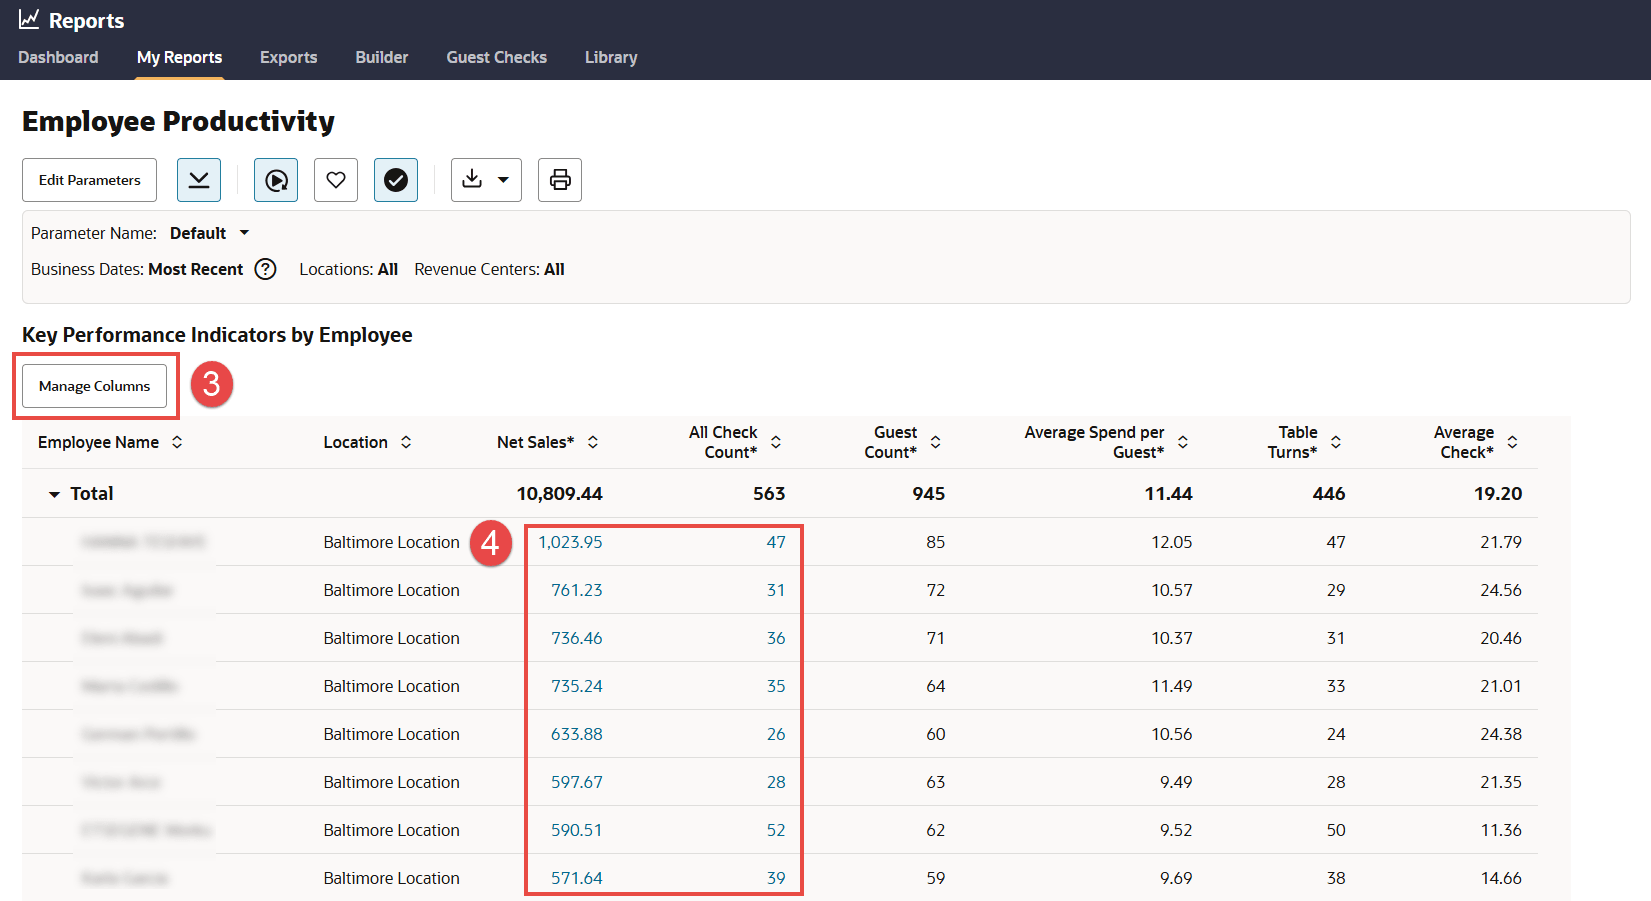
Features in reports are called out by number in the table and correspond to the images.
| Callout Number | Element | What It’s Used For |
|---|---|---|
|
1 |
Toolbar |
Edit parameters, show or hide report parameters, auto run reports, favorite reports, add reports to My Reports, download reports, and print reports. The toolbar appears on all reports. |
|
2 |
Report component |
View and interact with report components which include tables and charts. Hover over charts and more details will appear. Your permissions determine which report components are visible. |
|
3 |
Smart cell selection |
Select column headers for certain reports with smart cell options. |
|
4 |
Drill-downs |
Hyperlinked entries drill down to more detailed reports. |


Parent topic: Getting Started