5 Posting Performance
The Posting Performance page shows MRequests – requests and responses sent to and from CAPS workstations and Reporting and Analytics – and Queue metrics (the number of requests) for locations (CAPS workstations).
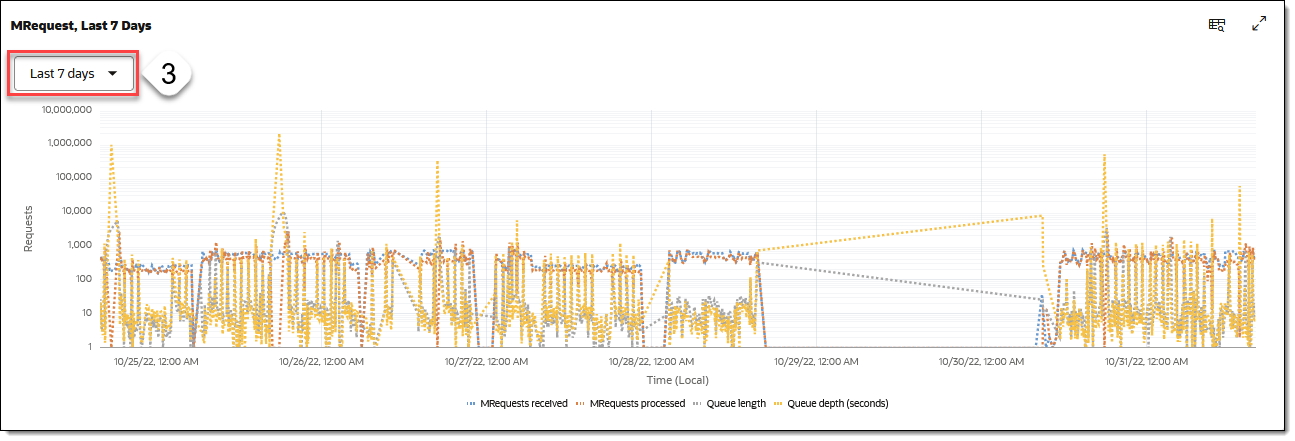
The page also provides graphical representations of posting activity, captured at 5-minute intervals and retained over a period of 28 days.
Tip:
To see a larger version of an image, right-click on the image to open it in a new browser tab.Status
Figure 5-1 Posting Performance Status Bar

| Area | Description |
|---|---|
|
MRequests Received |
Requests sent to a CAPS workstation.. |
|
MRequests Processed |
Requests that are successfully posted to Reporting and Analytics. |
|
Queue Length |
The number of requests waiting in the queue. |
|
Queue Depth |
The approximate amount of time (in seconds) it will take to process all pending requests. The Queue Depth thresholds
are:
|
Graphs
Figure 5-2 Posting Performance - MRequest, Last 24 Hours Graph

Figure 5-3 Posting Performance - MRequest, Last 7 Days Graph

| Callout Number | Area/Task | Description/Procedure |
|---|---|---|
|
1 |
Graph View |
This area displays the data, represented as a line graph. Hover your cursor over a data point to view more details. |
|
2 |
Legend |
This area displays the following types of data represented
within the graphs:
Click a desired data type in the legend to display only that data in the graph. |
|
3 |
Graph View Selection |
This only applies to the MRequest, Last 7 Days graph. From the drop-down menu, you can adjust the graph view to display data from the last 7 days, or from a specific date within the last 7 days. |
|
4 |
Maximize/Minimize Graph View Report |
Click the Maximize icon ( Click the Report icon ( |