Overview
Oracle Argus Analytics includes dashboards, reports, and metrics that let you view relevant, interactive information—current as at the last date the data mart was refreshed. It also includes dashboards and reports to access the run-time data.
Dashboards are access points for information. Each dashboard is designed for a specific job responsibility.
When you access a dashboard, the information displayed changes based on your security privileges. For example, a user with BIConsumer application role may not be able to see the same data as the user with BIAuthor role.
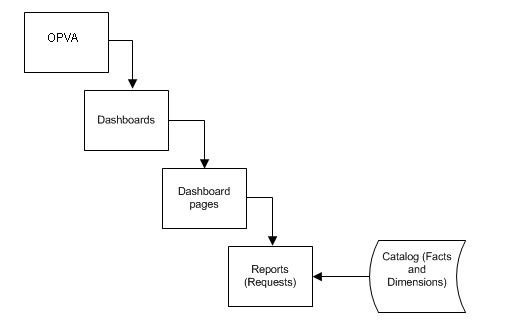
A dashboard contains one or more related dashboard pages. A dashboard page contains a series of related reports (also called requests). A report can contain a tabular report, pivot table, or graph. You can drill down to detailed report by clicking the linked data. You can also filter the data that you see in reports using a set of parameters (called filters). Figure 2-1 displays the report hierarchy.
In addition to the dashboards and reports that are packaged with Oracle Argus Analytics, you can also create and manage reports or dashboards if you have appropriate permissions. Use Oracle BI Analysis to manage reports.
Oracle Business Intelligence Enterprise Edition includes additional applications that are not directly used by Oracle Argus Analytics. These include Oracle Business Intelligence Agents and Oracle Business Intelligence Publisher. These applications extend the usefulness of the information provided by Oracle Argus Analytics.
Use Oracle Business Intelligence Agents to detect specific analytic results and notify appropriate user or group about the result. Use Oracle Business Intelligence Publisher to create formatted and printable reports.
See Also:
- Working with Reports for more information about creating and managing reports.
- Oracle Argus Analytics Presentation Catalog for more information about the columns in Oracle Argus Analytics that you can use to create and modify reports.
- Oracle Business Intelligence Administrator Guide and User Guide.
Parent topic: Using Oracle Argus Analytics
