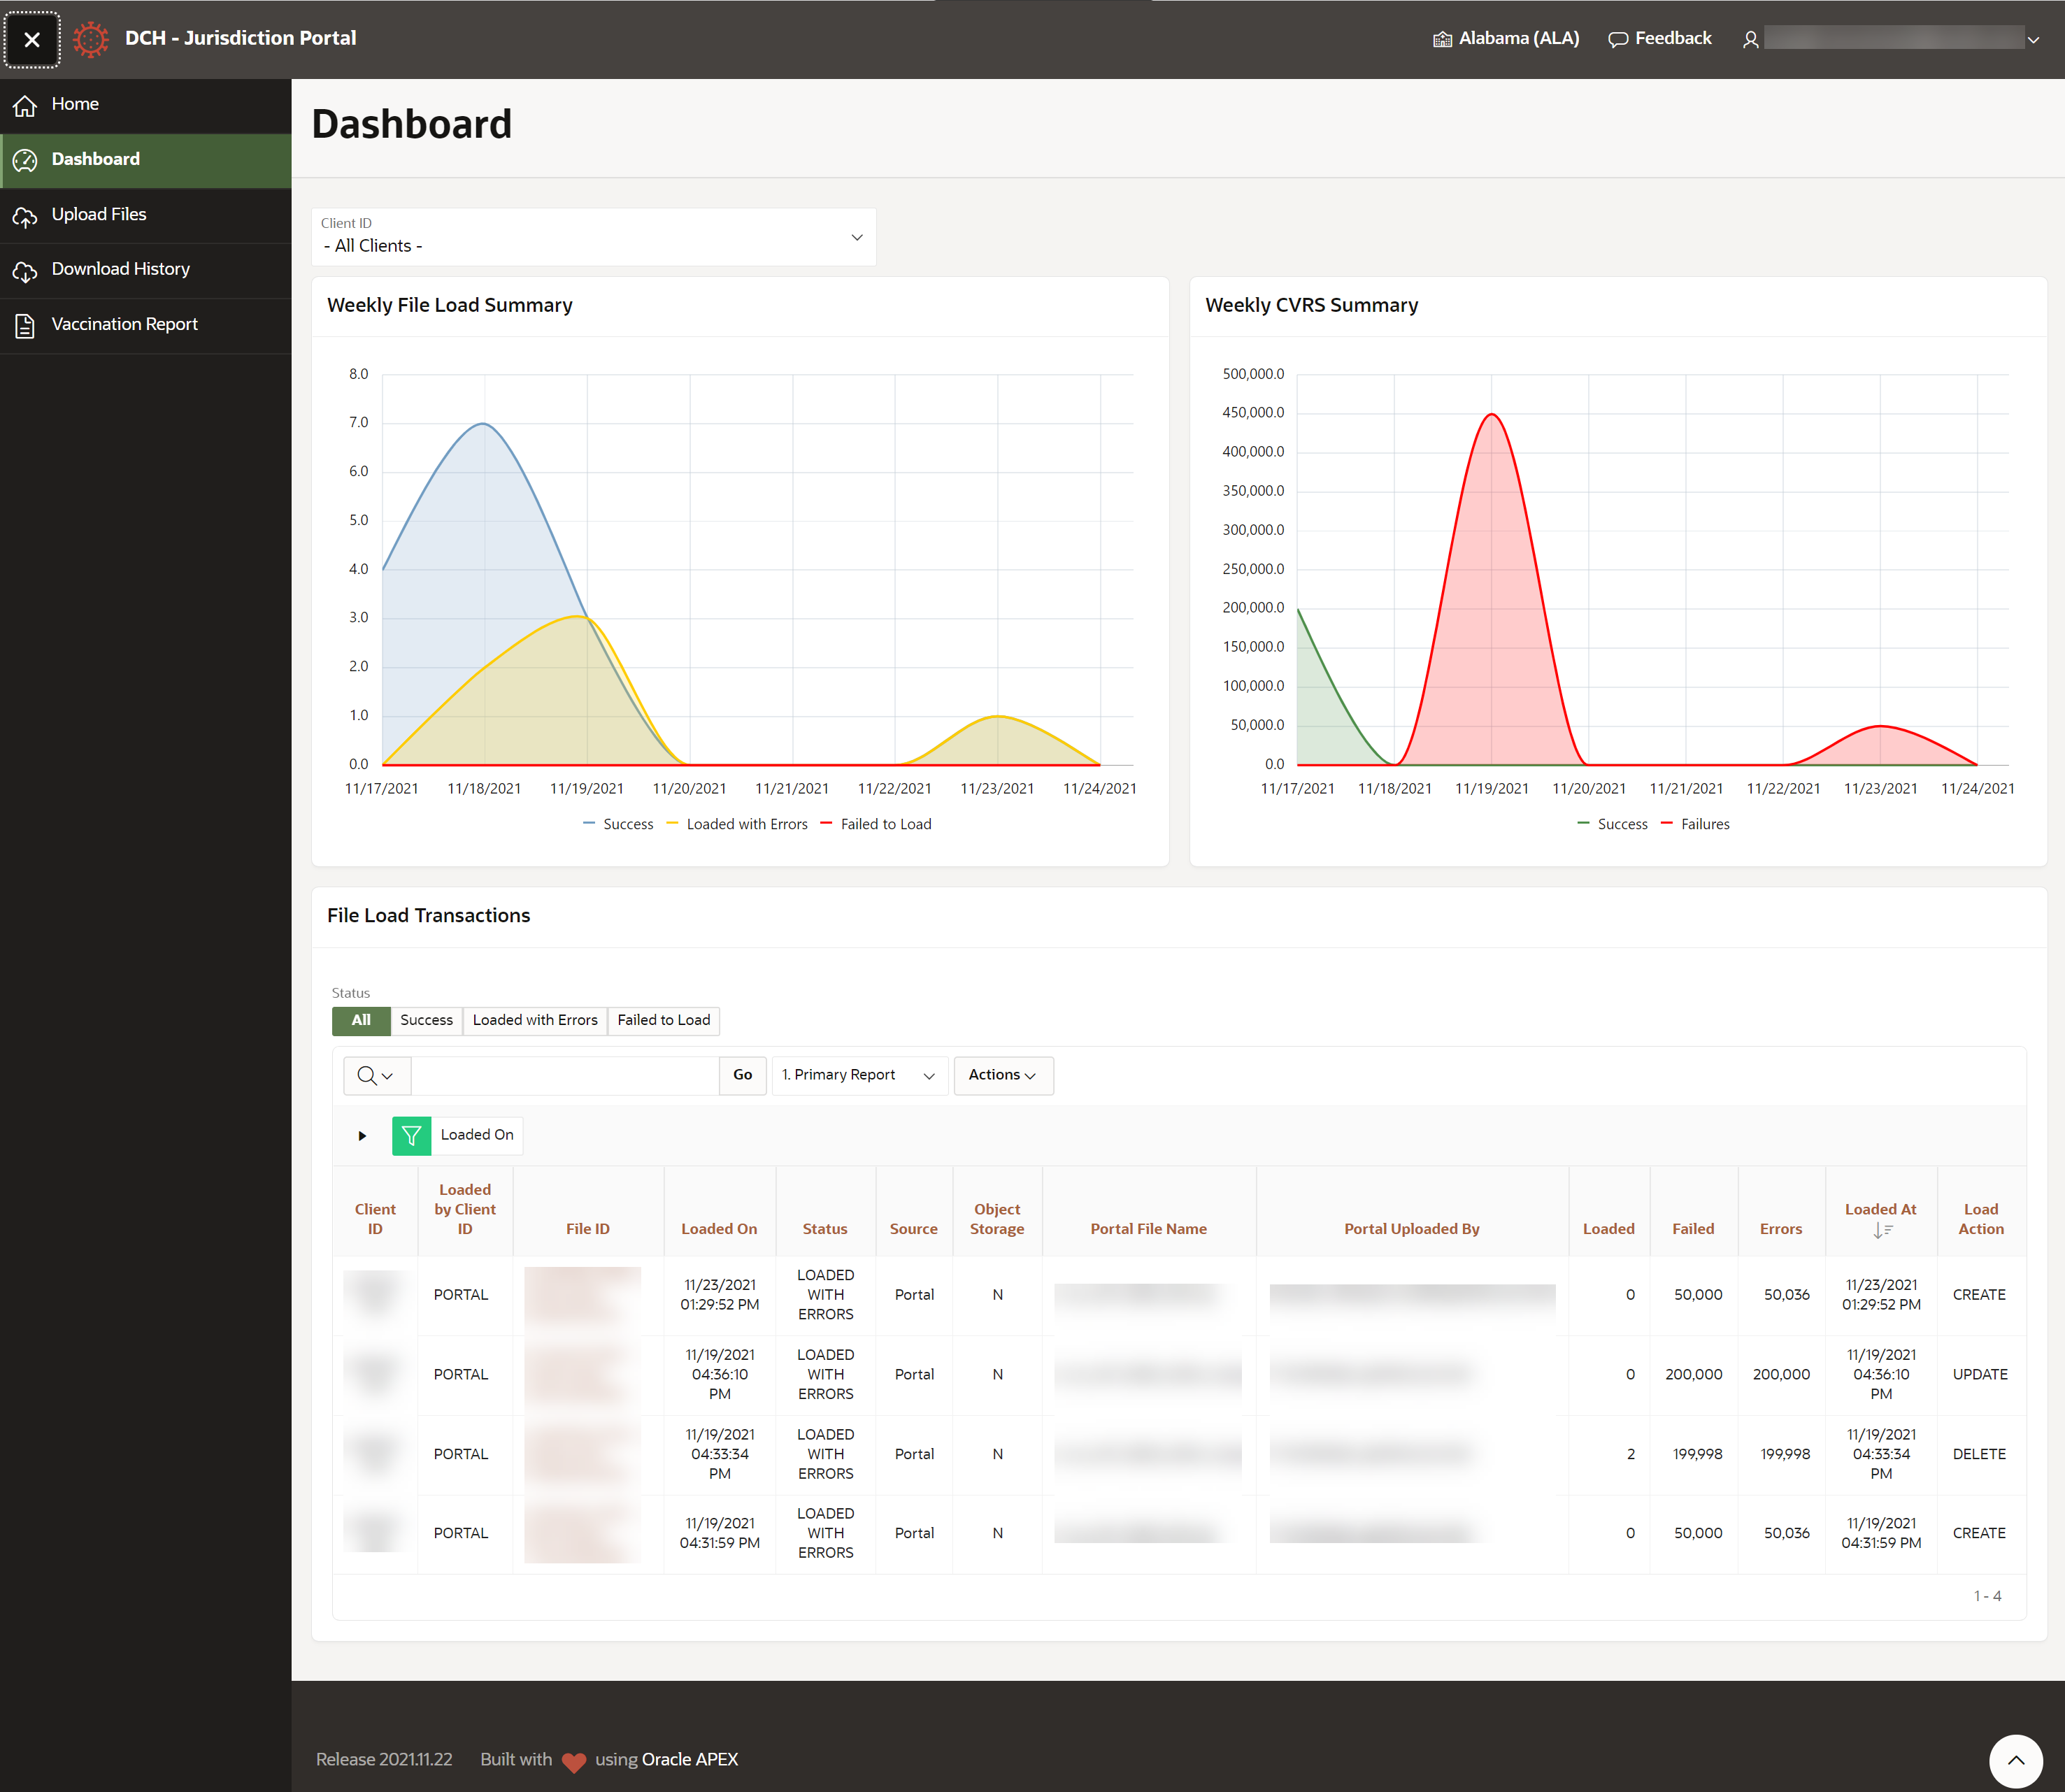
Review the Dashboard
Use the Dashboard to see graphs and data that track uploaded files and the vaccination record transactions contained in those files. For example, you can see data on successful and failed vaccination record transactions.

Table 2-1 Dashboard elements
| Element | Description |
|---|---|
| Client ID | When set to All Clients, the Dashboard displays the combined activity from all your authorized jurisdictions. When set to a specific jurisdiction, the Dashboard displays only the activity from that jurisdiction. |
| Weekly File Load Summary | This interactive graph tracks the status of files
uploaded during the past week.
Each point on the graph
indicates the number of files uploaded on that date. The three graph
lines separate the files by result:
|
| Weekly CVRS Summary | The interactive Weekly CRVS Summary graph tracks the number of CVRS record transactions that succeeded or failed to upload to Data Clearinghouse in the past week. Each point on the graph indicates the number of record transactions routed to Data Clearinghouse on that date. The two graph lines segregate the files into successful transactions and failed transactions. Hover over a label at the bottom of the graph to bring one of the graph lines into focus. Select a label to toggle that graph line on or off. |
| File Load Transactions | Use the File Load Transactions report to see information
about file uploads and information about the vaccination records in
those files.
For information on status codes from this report see File upload status information. |
Parent topic: Manage vaccination records