Study Health Monitor
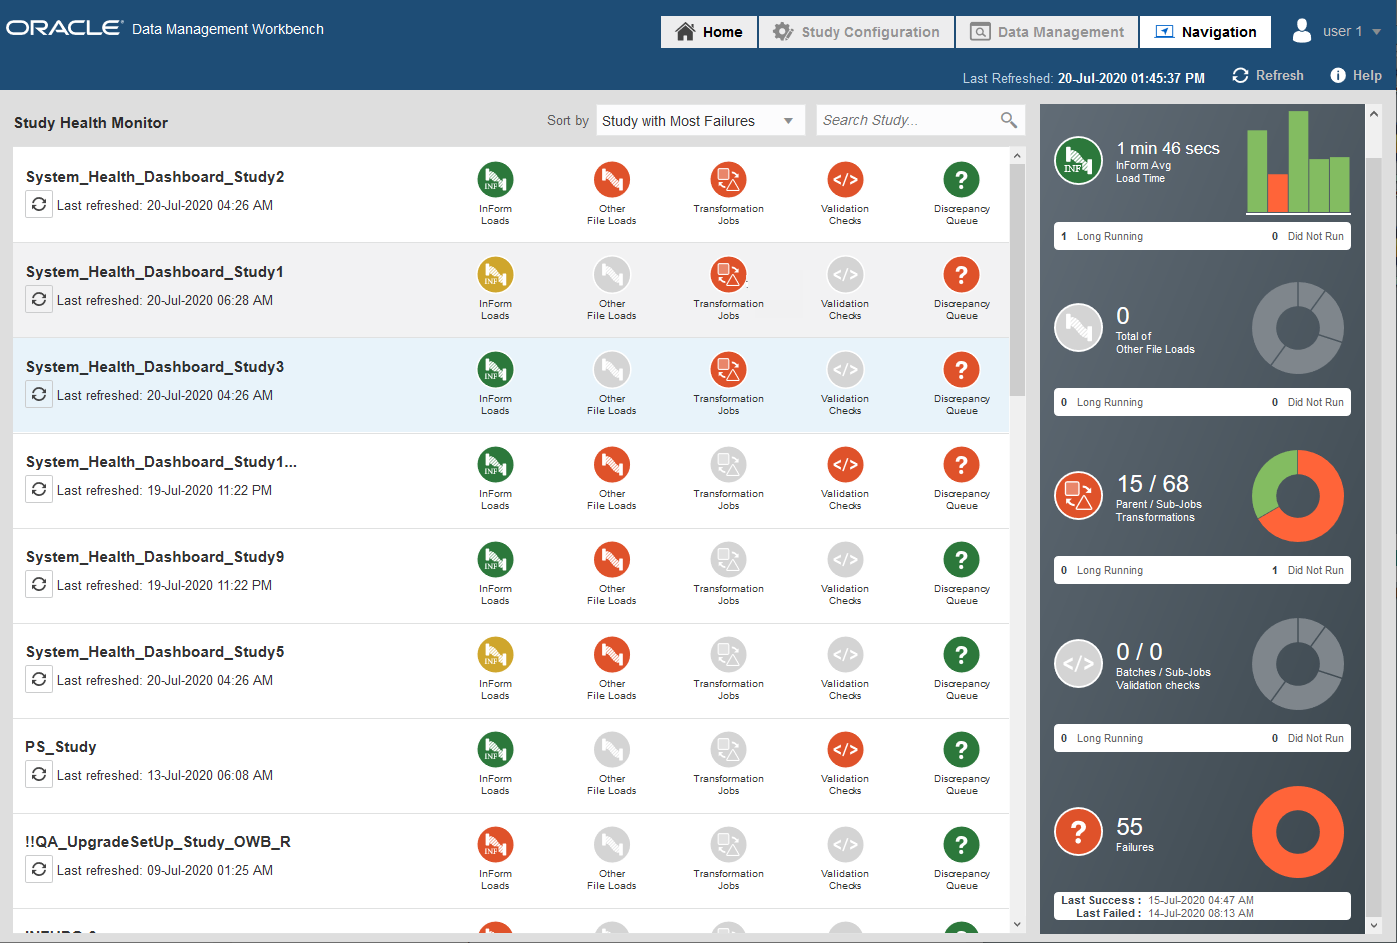
Oracle DMW system administrators can sign in to Oracle DMW and view the Study Health Monitor page through the Navigation menu. This page lists all the studies in the Production life cycle and includes details on the data loads, transformations, validation checks, and discrepancies in queue in each study.
The Study Health Monitor lists the studies with the most failures at the top so you can identify them quickly and take action. You also see the date and time that Oracle DMW last refreshed the data. (Oracle DMW automatically refreshes the data every 15 minutes.) You can also sort the studies by a particular status or search for a particular study by name.
- Green = Success
- Blue = Executing
- Yellow = Warning
- Red = Failure

You can hover your cursor over the bar graph or donut charts to see more information on the status (for example, job ID, date and time of an Oracle InForm data load, percentage of other data loads, transformations, validation checks, or discrepancies in a particular state). For more information, see the following topics.
- Study Health Monitor details panel
After you open the Study Health Monitor, you can click a study row to open a panel on the right. The panel shows details on the status for each item in the study. - Monitor study health
You can access the Study Health Monitor page at any time as long as you signed in with a System Administrator account.
Parent topic: Study monitoring