Data lineage example
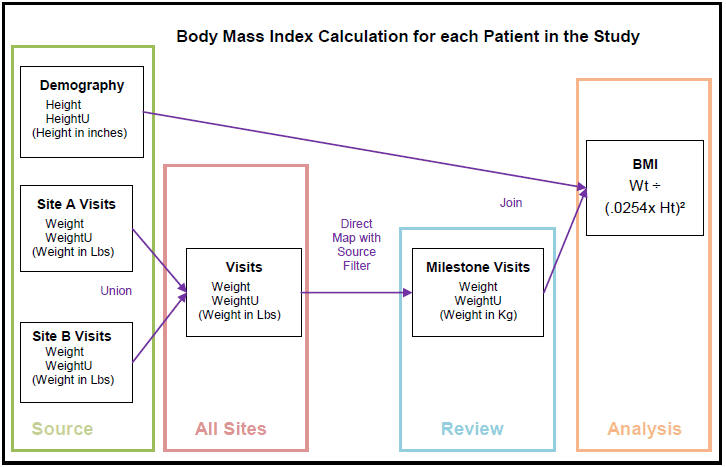
In this example, multiple data items in several data models contribute to the calculation of each subject's Body Mass Index (BMI).
Figure 8-1 Body Mass Index Calculation Example

Description of "Figure 8-1 Body Mass Index Calculation Example"
The calculations shown above result in the following data in table BMI in the Analysis model:
Table 8-6 Data in Table BMI
| Study | Subject | Visit | Site | Gender | Age | BMI | BMIU |
|---|---|---|---|---|---|---|---|
|
BMI |
1005 |
4 |
McLean |
MALE |
29 |
24.6 |
KG/M**2 |
|
BMI |
1006 |
4 |
McLean |
MALE |
54 |
28.8 |
KG/M**2 |
|
BMI |
1007 |
4 |
McLean |
FEMALE |
42 |
33.1 |
KG/M**2 |
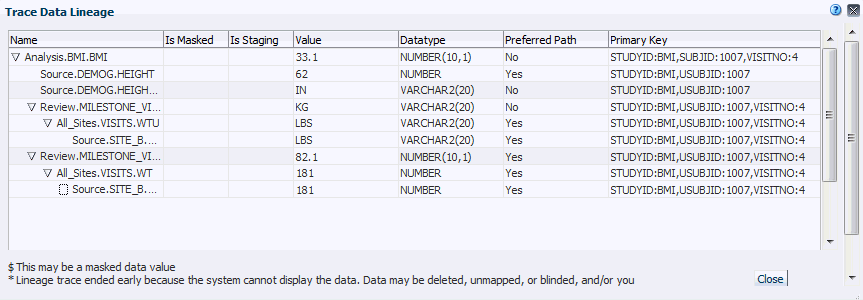
A BMI value over 30 is outside the normal range. To investigate the source data for Subject 1007, a female aged 42 with a BMI of 33.1, the reviewer selects the BMI data value 33.1 for Subject 1007 in the Listings page and clicks View Source Data.
Figure 8-2 Source Data Lineage Display

The Trace Data Lineage window displays the selected data item in the top row, with its sources displayed below. Expand any source to see its source. Columns are displayed in the format data_model.table.column.
The user can see downstream data by clicking View Target Data. The display shows the selected item at the top and the downstream data below.
Note:
If the system cannot display the entire lineage, it displays an asterisk (*) with a message about possible reasons.
Parent topic: How the system tracks data lineage