Set graph cutpoints and palette choices

The graph cutpoints define the ranges of values associated with different colors in the graph. The graph palette is the spectrum of colors used for graphs based on the results of data mining runs (including charts on the Drug Profile page) during your current session.

You can set a default palette as your user preference, Graph color palette.

Note:

Neither cutpoints nor color settings have any effect on the sector map graph, graphs that are based on report data, or graphs on the Oracle Empirica Signal Review Products and Product-Event Combination pages.
  1. In the left navigation pane, hover on the Data Analysis icon (Data Analysis icon), then click Data Mining Results.
  2. On the Select Criteria page, choose the run. Your Default Run user preference determines which run is selected by default.
    • To view all available runs, click Browse.
    • To see the details of the run, click View Run Details, examine the details, then click Close.
  3. Specify the selection criteria by completing steps 3 through 5 on Load the run and select variables.
  4. Click Choose Graph.
  5. Click Set Graph Cutpoint and Palette Choices.
  6. To change the cutpoints or minimum/maximum limits for a particular score range, enter an integer or floating point number in each of the range fields for a score such as EBGM, ERAM, PRR, or INTSS. For example:

    Change the cutpoints for a particular score range

    If you are unsure about the meaning of a score, see Data mining results for MGPS runs or Data mining results for logistic regression runs.

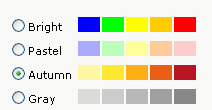
  7. To change the color palette, click one of the following radio buttons:

    Color palette radio buttons

    Your choices result in ranges with corresponding color gradations, as in the following example that uses the Autumn palette:

    Autumn palette

  8. Click Save.

Changes to the cutpoints and palette take effect immediately and apply to all graphs for your current session. The next time you log in, the cutpoints are reset to defaults and the palette is reset according to your user preference Graph color palette.