Information Component computations
When you specify data mining parameters for an MGPS run, you can include Information Component (IC) computations.
The IC is a measure of disproportionality between the observed and expected number of reports for a drug-event combination. The method was originally introduced at the Uppsala Monitoring Centre (UMC) for use with VigiBase by Norén et. al. [Norén GN, Hopstadius J, Bate A. Shrinkage observed-to-expected ratios for robust and transparent large-scale pattern discovery. Statistical Methods in Medical Research. 2013;22(1):57-69.].
A positive IC indicates that the number of observed reports is greater than the number of expected reports. Similarly, a negative IC indicates that the number of observed reports is less than the number of expected reports.
Oracle Empirica Signal computes IC values only for drug-event combinations. For example, if you create a three-dimensional MGPS run, Oracle Empirica Signal computes IC values for each drug-event combination, and disregards the following:
- Combinations of one drug and two events.
- Combinations of two drugs and one event.
- Combinations of three drugs.
- Combinations of three events.
IC values include the following:
- IC—Information component
- IC025—Lower limit of the 95 percent confidence interval for IC
- IC975—Upper limit of the 95 percent confidence interval for IC
If you selected stratification variables for the run, the expected number of reports (E) is adjusted using the Mantel-Haenszel approach. For more information, see Stratification variables.
If you defined a subset variable for the run, Oracle Empirica Signal computes results for each value of the subset variable with observed cases in the data.
Drug-event combination scores
- Oracle Empirica Signal determines the observed counts for each drug-event combination as
follows:
Event Drug of interest All other drugs Event of interest
a
b
All other events
c
d
- a—Number of reports of the drug of interest and the event of interest.
- b—Number of reports of the event of interest and not the drug of interest.
- c—Number of reports of the drug of interest and not the event of interest.
- d—Number of reports of neither the event or drug of interest.
- Oracle Empirica Signal computes the expected counts for each drug-event combinations as follows:
Event Drug of interest All other drugs Event of interest
E(a)=((a+b)(a+c))/(a+b+c+d)
E(b)=((a+b)(b+d))/(a+b+c+d)
All other events
E(c)=((c+d)(a+c))/(a+b+c+d)
E(d)=((c+d)(b+d))/(a+b+c+d)
- Oracle Empirica Signal computes the IC metric for each drug-event combination as follows:
Figure 4-1 Equation 1

For computation of the 95% confidence interval (denoted as IC025 and IC975), the paper by Norén et. al proposed a simplified approach as follows:
Figure 4-2 Equation 2

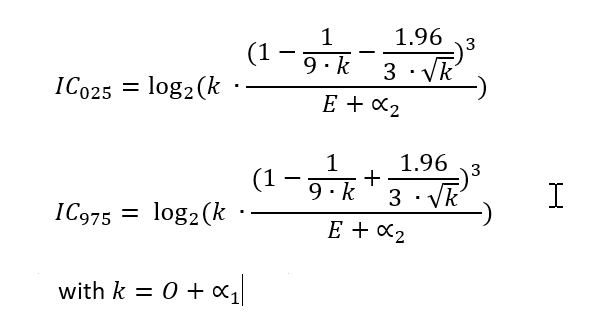
With the simplified approach, the confidence interval bounds are being estimated slightly too low for small counts, and slightly too high for larger counts of cases (compared to an exact computation based on the gamma posterior distribution). To achieve a higher accuracy beyond the first decimal, Empirica Signal applies an algorithm based on the Wilson-Hilferty transformation [Wilson EB, Hilferty MM. The Distribution of Chi-Square. Proc Natl Acad Sci U S A. 1931 Dec;17(12):684-8.]. Some transformations are needed to the Wilson-Hilferty notation to convert from their chi-squared formulation to use the equivalent Bayesian posterior incomplete gamma quantiles which are used in Empirica Signal, resulting in
Figure 4-3 Equation 3

where 0 is the observed count, E is the expected count, as detailed above.
Parent topic: Reference