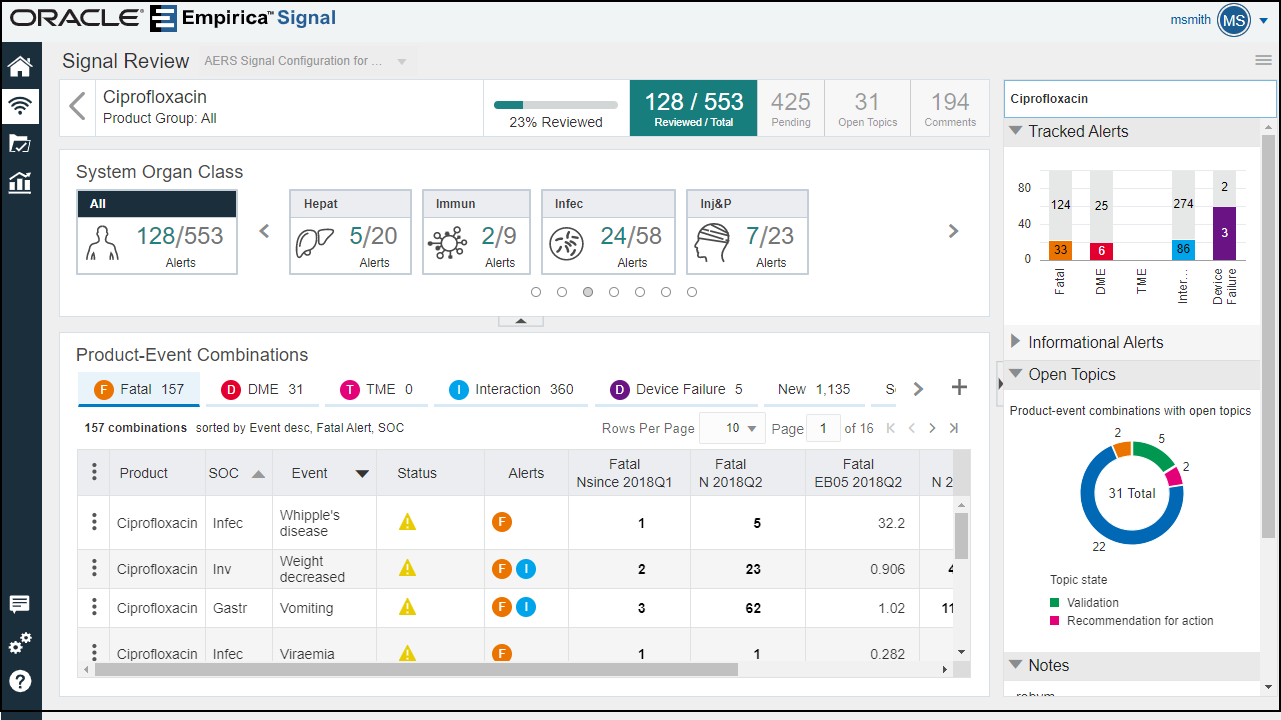
Panels of the Product-Event Combinations page
The Product-Event Combinations page provides easy access to a variety of functions and comprehensive product-event information and statistics.
The Product-Event Combinations page is similar to the Products page. To display it, on the Products page:
- From a Row Action menu (
 ), select View Product-Event Combinations, or
- Click the product name, or
- Click a total count in a cell in the Products table.
The Product-Event Combinations page appears.

Product Summary information (across the top): Product statistics appear here with the product name and Products By group, product group, percentage reviewed gauge, count of reviewed/total tracked alerts, the number of pending (unreviewed) alerts, product-event combinations associated with open topics (available if the signal configuration is integrated with Topics), and count of product-event combinations with comments.
![]()
System Organ Class (SOC) cards: The cards represent the alerts grouped by MedDRA system organ class. The counts represent Reviewed/Total tracked alerts. Selection of a card filters the Product-Event combinations table.

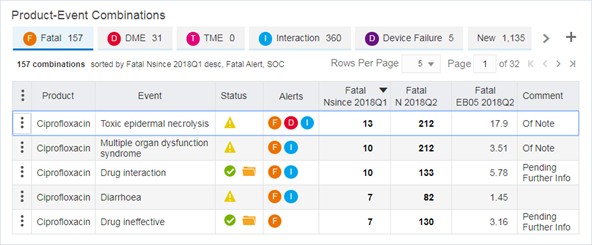
Product-Event Combinations panel: Tabs for each alert and optional tabs associated with signal views are shown below the cards. A Product-Event Combinations table for each selected tab shows product-event rows for the selected product and alert or signal view. Each table displays a summary line with the number of combinations, the sort order, the number of rows per page and the page number. You can add tabs, change pages, and customize the columns.

- Select another tab to show the Product-Event Combinations table associated with a different tab such as the Fatal, Serious, or New product-event combinations.
- The Status column indicates if the product-event combination has been reviewed and if there is a topic for the product-event combination.
- The Alerts column indicates which tracked alerts relate to the product-event combination in the most recent refresh. The icon color and letter were set up when the alert type was created and match the icons in the tabs. In the example above, F stands for Fatal and D for Designated Medical Event.
- Each tab contains the table for that alert type or signal view and
reflect the current product and SOC selection. Hover over an alert tab for details
about that alert type. You can add more tabs with the
 icon on the right.
- Click the hyperlinked (bold) value in a cell to display a menu
to drill down to case-specific information. Menu items include:
- View Cases
- Create Case Series
- Transfer to Case Series
- Download Cases
- Download Case Details
- Reports to view a list of reports about cases and generate a report.
Detail panel: The Detail panel on the right graphically depicts Recent
History, Signal Statistics, Subgroup Statistics, and Associated topics for the selected
product-event combination. Topics appear only if your configuration is integrated with
Oracle Empirica Topics. You can select different variables to graph, such as All EB05, Age Group, or Gender,
using the drop-down lists in the Signal Statistics or Subgroup Statistics sections. To
perform further actions on the data associated with a bar or donut slice, click the bar
or slice to display the Action menu. You can select View Cases or other actions related
to case series and reports. You can show (![]() ) or hide (
) or hide (![]() ) the sections in the Detail panel. If you add a comment or change the
associated topic information, the panel updates.
) the sections in the Detail panel. If you add a comment or change the
associated topic information, the panel updates.

- Recent History: Displays the most recent product-event alert and comment information plus up to two other rows of alert and comment information. It also includes a link to the Signal History page.
- Signal Statistics: Displays two graphs: a line graph for the chosen statistic and a bar graph for the chosen count. You can select a different statistic or count to update the graph. You can drill down to cases and generate reports from the bars in the bar chart.
- Subgroup Statistics: Displays a donut chart of case counts for a subgroup, such as Gender. You can select a different subgroup to update the graph. You can drill down to cases and generate reports from the sections of the pie chart.
- Associated Topic: Displays information about a topic if
associated with the product-event combination, including counts of open and
overdue actions. Click
 to view the topic in the Topic Viewer.