Create graphs

To create a graph, do the following:

  1. Click the menu icon in the upper-left corner in the Home page.

    The menu items are listed.

  2. Click Graphs.

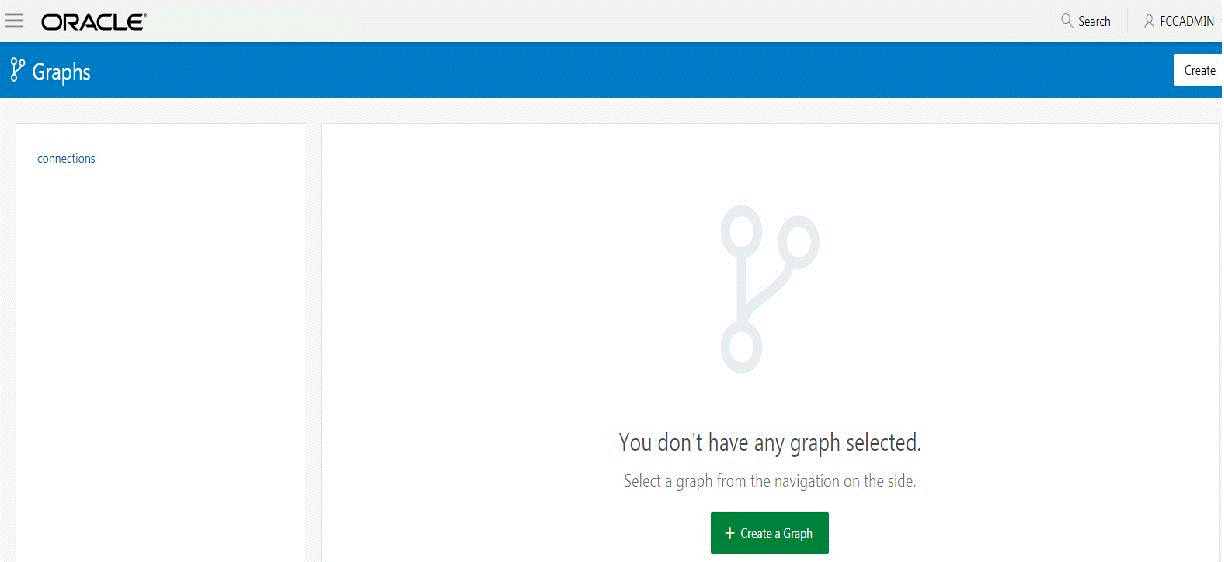
    The Graphs page is displayed.

    The Graphs page
  3. Click Create a Graph.

    The Create new Graph Configuration dialog box is displayed.

  4. Click the Plain Mode icon on the left.
  5. Enter a Name for the graph.
  6. Enter the JSON Configuration as shown in the following example:
    {        "vertex_labels": false,        "edge_label": true,        "loading": { "
                load_edge_label": true        },        "date_format": "yyyy-MM-dd HH:mm:ss",        "vertex_props": [        {            "type": "string",            "name": "type"        },        {            "type": "string",            "name": "religion"        },        {
                "type": "string",            "name": "company"        },        {            "type": "string",            "name": "musicGenre"        },        {            "type": "string",            "name": "show"        },        {            "type": "string",            "name": "name"        },        {            "type": "string",            "name": "country"        },        {            "type":
    "string",            "name": "team"        },        {            "type": "string",            "name": "genre"        },        {            "type": "string",            "name": "occupation"        },        {            "type": "string",            "name": "role"        }    ],    "edge_props": [
            {            "type": "float",            "name": "weight"        }    ],    "format": "edge_list",    "vertex_id_type": "integer",    "attributes": {},    "header": "",    "uri": "http://<hostname>:<port>/graphs/connections.edge_list",    "separator": "\t "}
  7. Click Create.

A graph configuration is created. This newly created graph configuration can be used in a notebook for the following:

  • Load a graph using the PGX interpreter.

    To load a graph, create a notebook and create a paragraph with pgx interpreter. Enter the code format given in the following example:

    graph = session.readGraphWithProperties(dataSourceName, 'graphName')

    Here dataSourceName refers to the graph name that you have created.

  • Query a graph using the PGQL interpreter.

    To query a graph, create a notebook and create a paragraph with the PGQL interpreter. Enter the code format given in the following example:SELECT n,e,m FROM GRAPH_NAME MATCH (n) -[e]-> (m) Here GRAPH_NAME refers to the graph name that you have created.