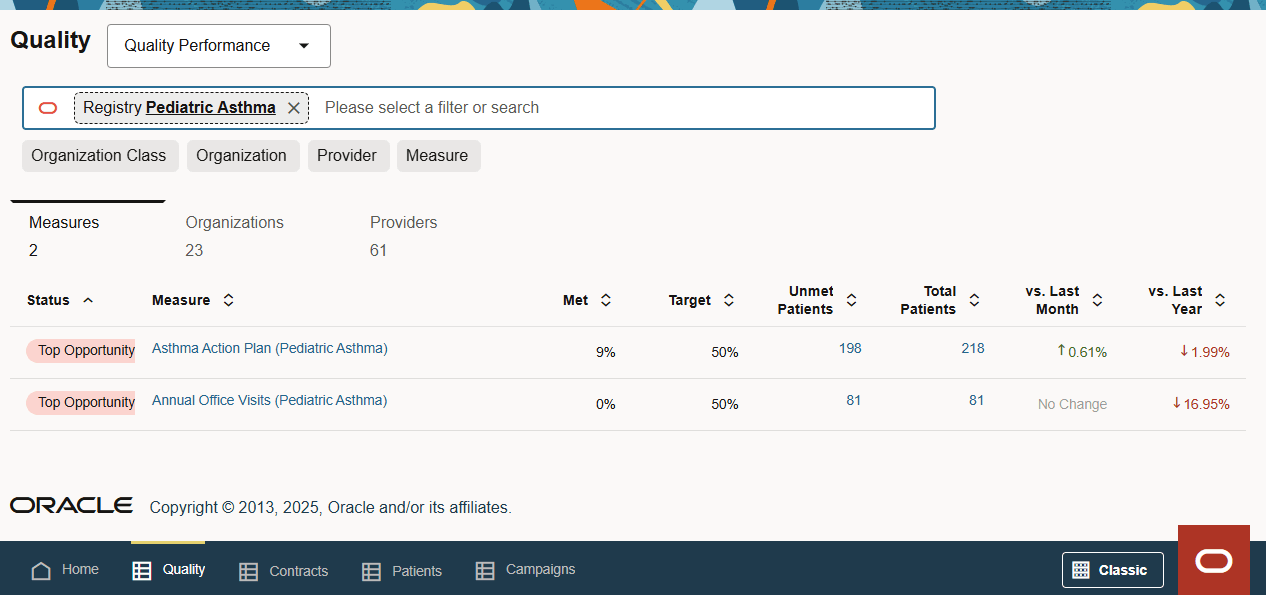
Measures View
The Measures view displays a list of relevant quality measures and their current status.
The Measures view provides information required to understand the healthcare organization’s quality performance and identify areas for improvement. If a provider filter is used, this displays the measures that the specific provider is scored against in the Score Plan tool. If an organization filter is used, measures that the organization is scored against in the Score Plan tool are displayed. If an organization class only has provider score cards set up and no organization score card set up in the Score Plan tool, no measures are displayed in the Measures tab. If a provider filter is added, only the measures the filtered provider is scored against are displayed in the Measure tab.

Table 2-3 Measures view columns
| Column | Definition |
|---|---|
| Status | The status of the measure as defined by the Top Opportunity algorithm. See Overview of the Opportunity Index in HealtheRegistries on Oracle Health wiki for details. The status can have one of the following labels:
All other measures have no status label. |
| Measure | The name of the measure. The measure name is displayed with the associated registry in parentheses.
For example:
|
| Met | The met percentage of the specific measure. This percentage is calculated using the total number of scorable patients that have met the specific measure divided by the total number of scorable patients in the measure’s denominator. |
| Target | The target the user has set for this measure in the Score Plan tool. If no target is set, No Target Set is displayed. The target value used in this column is identical to the value used on the scorecard in HealtheRegistries. |
| Not Achieved Patients | The number of patients that need to be added to the numerator to meet the target for the measure.
|
| Total Patients | The total count of scorable patients included in this measure based on the measure's inclusion criteria. This includes patients that have both met and not met this measure.
You can select the numerical value to access the Patients page to view the list of patients for this specific row. |
| vs. Last Month |
The difference in met percentage between last month's met percentage and the current met percentage. For example, if today is July 5, compare the met percentage with June 1. Snapshots are taken at the beginning of every month, so data points are compared to the beginning of the previous month. If data is not available, the system displays No Data. This can happen if the measure was recently enabled. |
| vs. Last Year |
The difference in met percentage between last year's current percentage and the current met percentage. For example, if today is July 5, 2024, compare the met percentage with July 1, 2023. Snapshots are taken at the beginning of every month, so data points are compared to the beginning of the same month from the previous year. If data is not available, they system displays No Data. |
Parent topic: Quality Performance