View the dashboard statistics on the requests

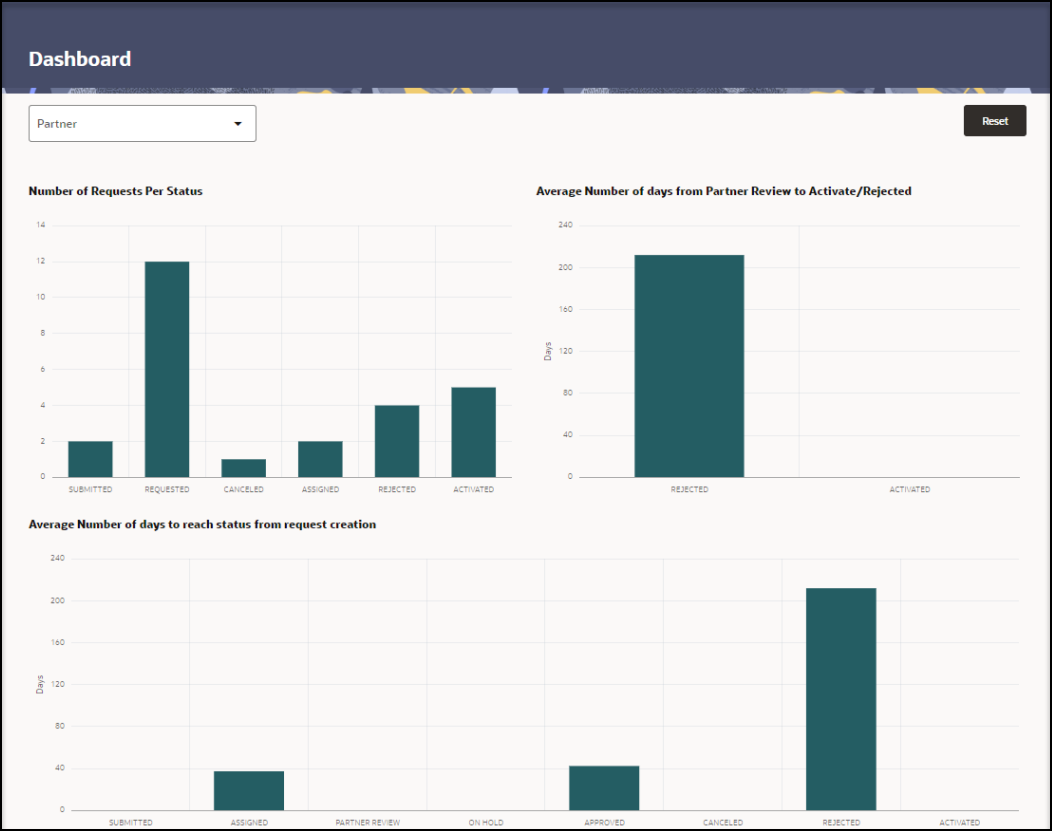
The dashboard shows bar graphs with statistics on the requests submitted by Self-Service Request Portal that track how quickly requests move through the approval process.

You can view statistics for a single partner or multiple partners. The statistics include the number of requests per status, the average number of days from partner review to activate/rejected, and the average number of days to reach status from request creation.

To view the dashboard statistics:
  1. Open the Navigation pane, and select Dashboard. The Dashboard page opens. For example:

    Dashboard page

  2. At the top of the Dashboard page, in the Partner drop-down menu, select a partner (or leave the selection blank to show all Partners).

    Note:

    The Partner drop-down menu is visible only to administration users and reviewers; it does not appear on the page if you are a partner reviewer. If you are a partner reviewer, the Dashboard shows the statistics for your partner.
  3. In each of the following sections, hover over the bar graph above a status to view the statistics. For descriptions of the statuses, see View the self-service statuses.
    • Number of Requests per Status
    • Average Number of days from Partner Review to Activate/Rejected
    • Average Number of days to reach status from request creation
  4. Select a bar graph to open the Requests page to view the list of requests with the selected status. For more information, see View the details for a request.
  5. Repeat steps 2 to 4, as needed. Selecting a different partner automatically refreshes the graphs.

    Note:

    Select Reset to clear the partner selection and show the graphs with data for all partners.