Reports (Drug Profile page)
The reports that you can add as charts to a drug profile are based on report output generated by an all cases summary report. If the report output uses a breakdown variable such as gender, you can add a report chart showing distribution by that variable.
N represents a count of unique cases with at least one occurrence of the row value. Percentages are computed as N divided by the total of N for all rows in the report chart. The percentage values are meaningful only for demographic data, such as gender, where there is one row value per case, so the total of N is the total of unique cases. In this context, the percentage is for the number of cases with the row value out of the total number of cases.
If there are multiple row values (for example, outcomes) per case, the total of N for all rows is the number of non-unique cases. Thus, percentage values are the number of cases with the row value out of the number of non-unique cases with any of the row values. This is not likely to be a meaningful statistic.
- To set options for the report chart, click Options.
- Specify whether you want to view the report chart as a table, a bar graph, or a pie chart, and then click OK.
- For a table or bar graph, you can click on a cell or bar and drill down to a list of cases, create a case series, transfer to case series, download cases, download case details, or run reports for those cases.
Examples
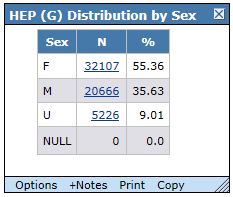
In the following report chart, each case can be counted for only one row. The total of N represents the unique number of cases, which is 57999. The percentage of unique cases for gender F is 32107/57999, which is 55.36.

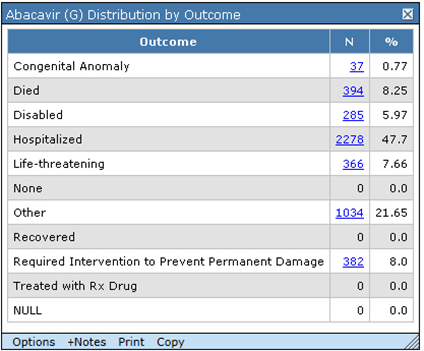
In the following report chart, each case can be counted for multiple rows. The total of N (4776) for all rows is more than the unique number of cases (4532). Thus, the % is not based on a count of unique cases.

Parent topic: Chart types and options