4 Cycle Times
Workbook synopsis
The Oracle Site Analyze Cycle Times workbook, intended for Oracle Site Select customers, allows you to view detailed data related to CDA, Oracle Site Select LITE, Selection, and Survey cycle times.
Dashboards and sheets
Key Cycle Times dashboard
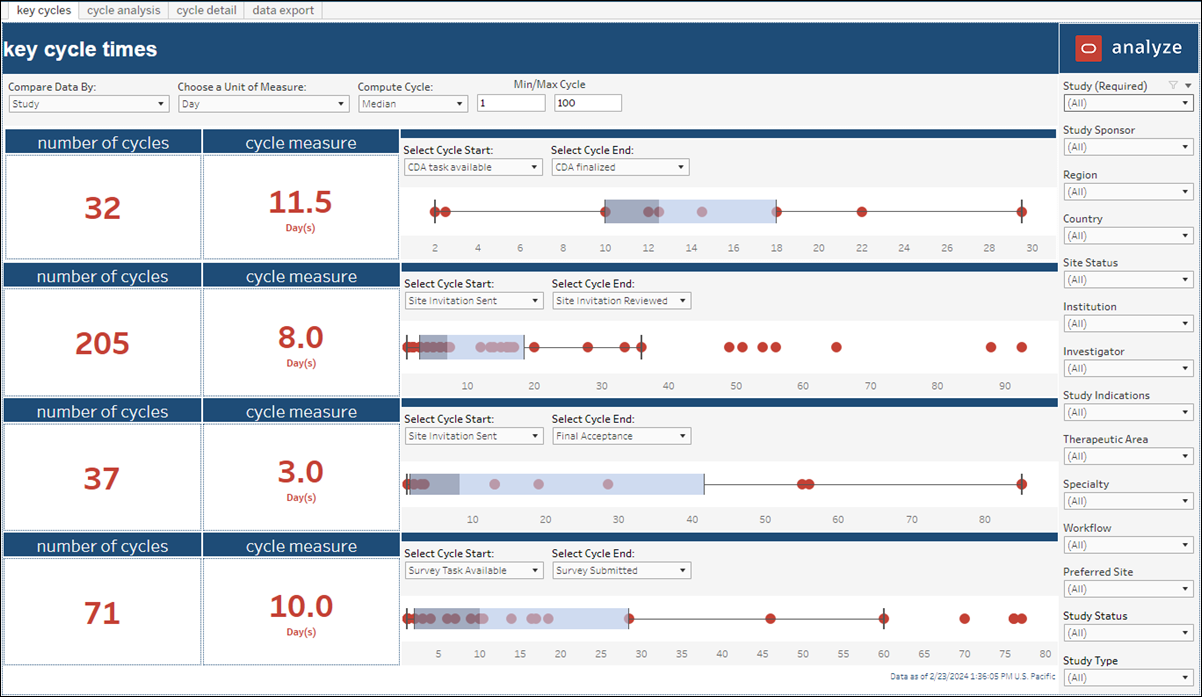
The Key Cycle Times dashboard allows you to configure your cycle time parameters of interest (e.g., start at CDA task available and end at CDA finalized). Choose your preferred parameters from “Select Cycle Start” and “Select Cycle End” drop-down menus.
Once you've selected parameters, the Key Cycle Times dashboard displays cycle times in a box and whisker plot, with cycle time in days. At the upper left of the dashboard, use the following filters to refine the display:
Compare data by
- All
- Region
- Country
- Study
- PI
- Workflow
Unit of measure
- Day
- Week
- Month
Compute Cycles by
- Median
- Average
You can also specify the Minimum and Maximum cycles by entering a numerical value (1-100) in the Min/Max Cycle fields and use the options in the filter panel to the right to further refine the dashboard by sponsor, study, and more.

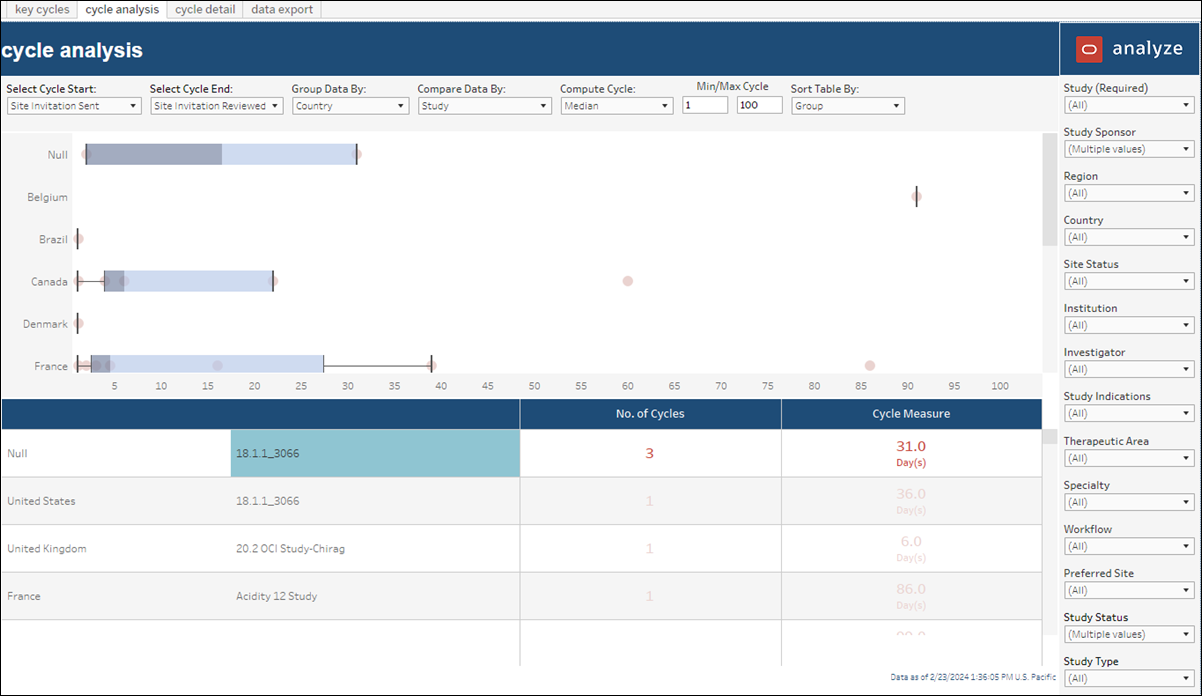
Cycle Analysis
- Cycle Start: CDA Task Available, Site Invitation Reviewed, Site Invitation Sent, Survey Submitted, Survey Task Available
- Cycle End: CDA Finalized, Final Acceptance, Site Invitation Sent, Survey Submitted, Survey Task Available
- Slice Data: All, Region, Country
- Compare Data: All, Region, Country, Study, PI, Workflow
- Compute Cycles By: Median or Average
- Unit of Measure: Day, Week
- Sort Table: Data Slice, No. of Cycles, Cycle Median
You can also adjust data included in cycle analysis using multiple filter options (e.g., Sponsor, Study Name, Region, Country, Study Status, Study Type, and more) provided in the filter panel to the right.

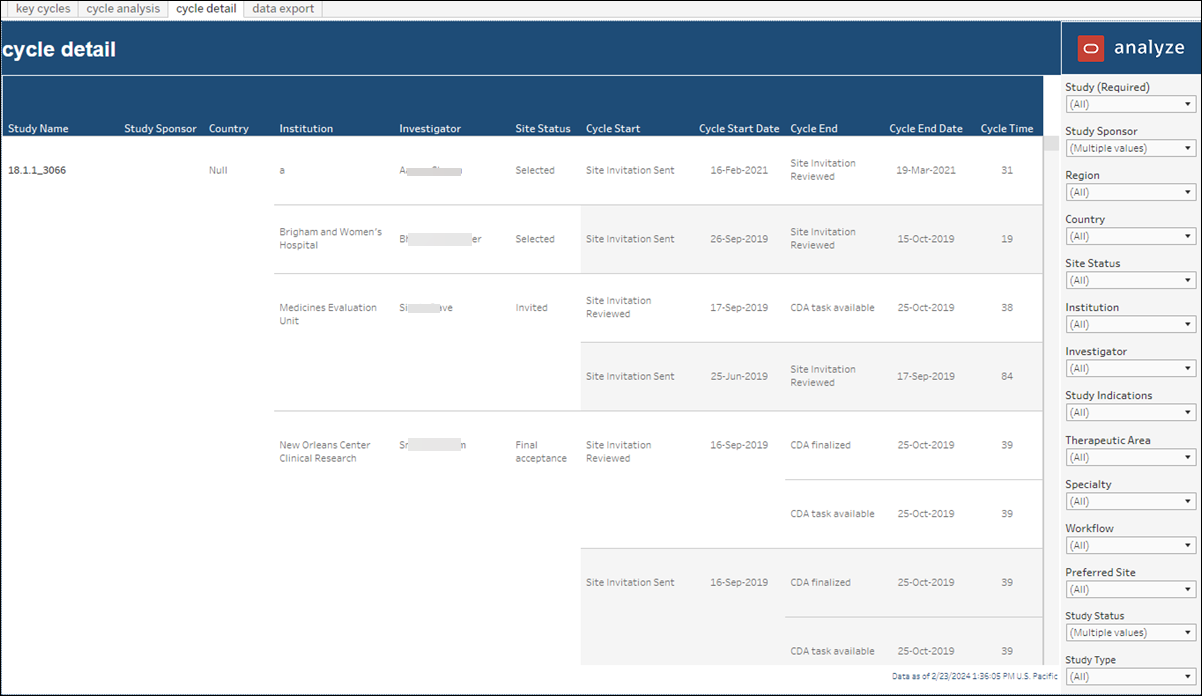
Cycle Detail
On both the Key Cycle Times and Cycle Analysis worksheets, described above, you can click any cycle point in a whisker plot diagram to access a “View Cycle Details" link. That links to the Cycle Detail worksheet with the data that makes up the value in the whisker plot diagram.


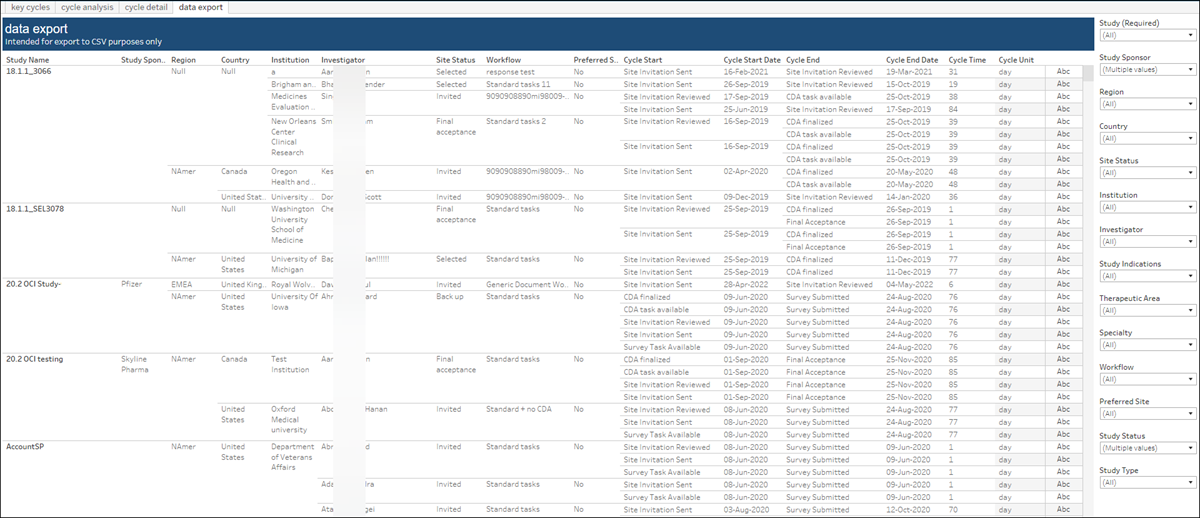
Data Export
The Cycle Times report includes a Data Export worksheet that provides a downloadable version of the data used to create the cycle times metrics. This export worksheet is intended for export to CSV format.
