18 Study Summary
Workbook synopsis
The Study Summary workbook, which is intended for Oracle Site Activate customers, provides easy interpretation of overall study status; visibility into unplanned, past due, and upcoming milestones; and milestone and submissions progress at the country and site level. Detailed sheets, described below, complement the Study KPIs dashboard sheet, enabling report users to quickly pinpoint milestones and submissions that are upcoming or past due.
Dashboards and sheets
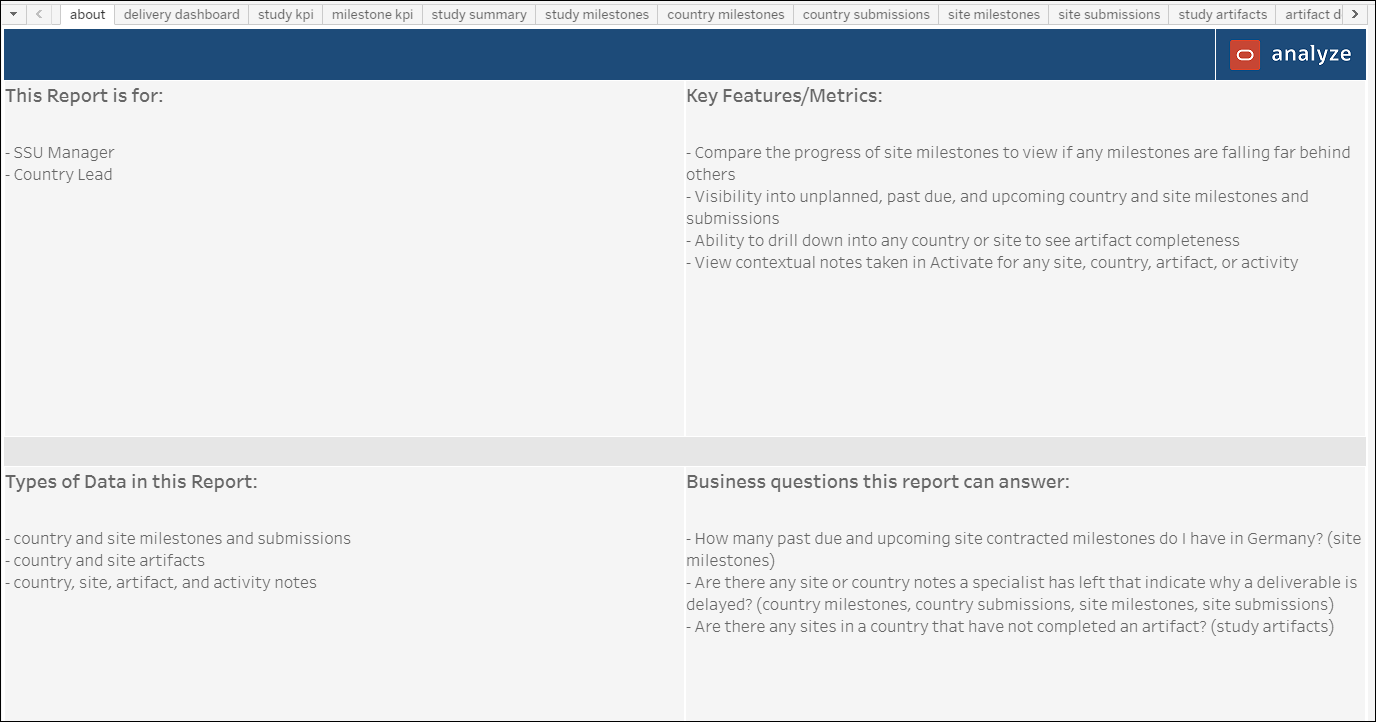
About
- Study startup roles that would use the report
- Key report features and metrics
- Types of data the report contains
- Examples of how to use the report to answer a business question
Delivery Dashboard
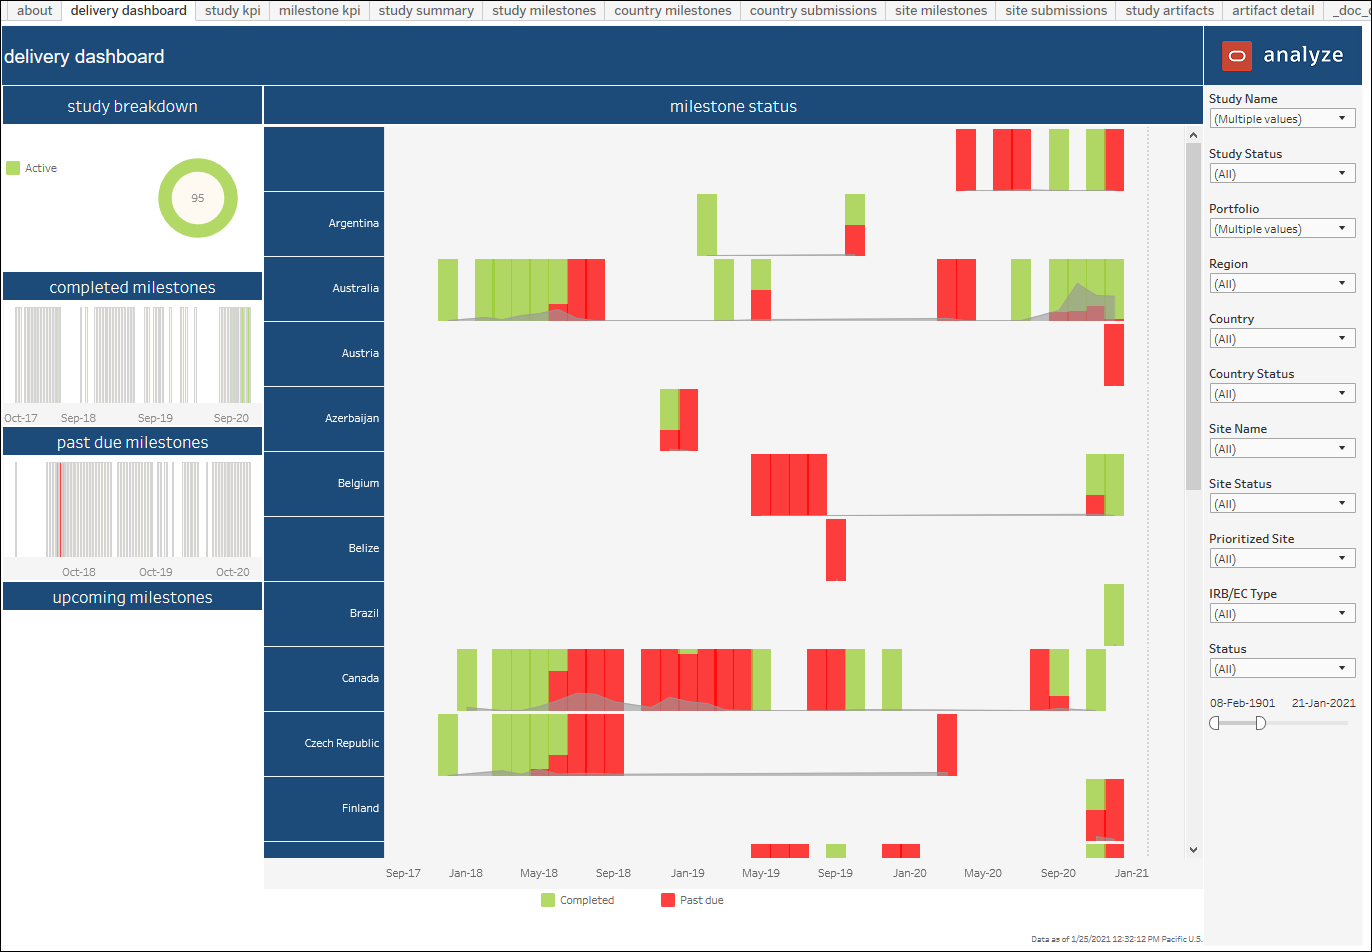
The Study Summary report's Delivery Dashboard is intended to help you to understand how remaining study milestones are distributed over time (day, week, month) so that your organization can correctly balance workload and achieve expected outcomes.
- Study status breakdown (active, inactive, completed, etc.)
- Completed milestones heat map (weekly trend of milestones completed, with darker green meaning more milestones completed that week)
- Past due milestones heat map (weekly trend of milestones past due, with darker red meaning more milestones past due that week)
- Upcoming milestones heat map (weekly trend of milestones planned, with darker orange meaning more milestones planning that week)
The remainder of the Delivery Dashboard sheet reflects milestone status. For each country, the dashboard shows a weekly trend of milestones past due, completed, due in less than 15 days, due in greater than 15 days. The milestone statuses are represented by stacked bar chart.
Additionally, the milestone status dashboard includes shaded line graphs over the bar charts to show you the relative volume of milestones each week. You can use the line graphs to interpret milestone volume at a glance.
Study KPI Dashboard
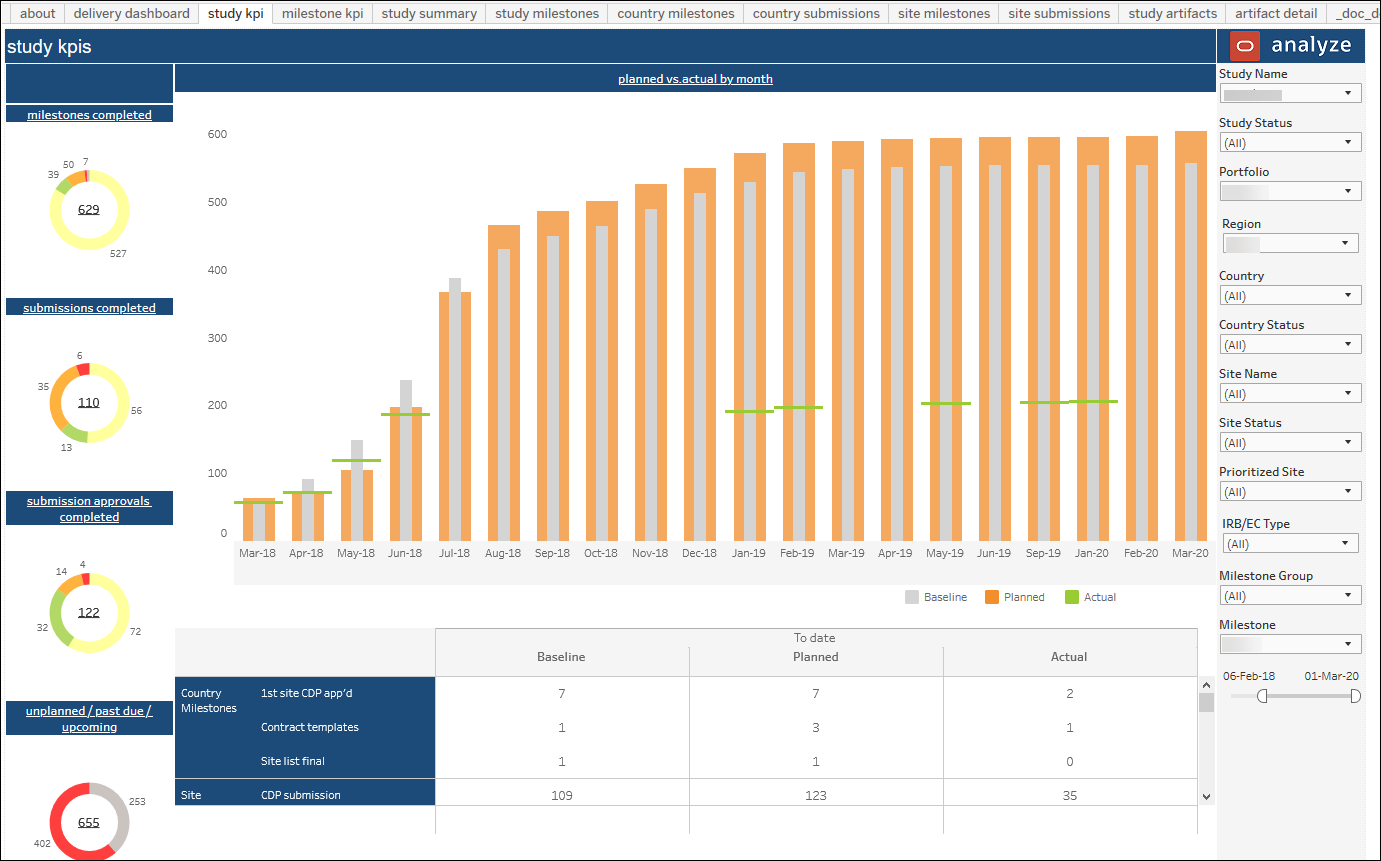
This dashboard provides a high level graphical view of progress to plan over time for milestones and submissions. Hover-over tool tips for circle and bar graphs provide additional details. You can filter the dashboard by: Study Status, Portfolio, Study Name, Country, Site Status, Site Name, Milestone Group, Milestone, and date range.
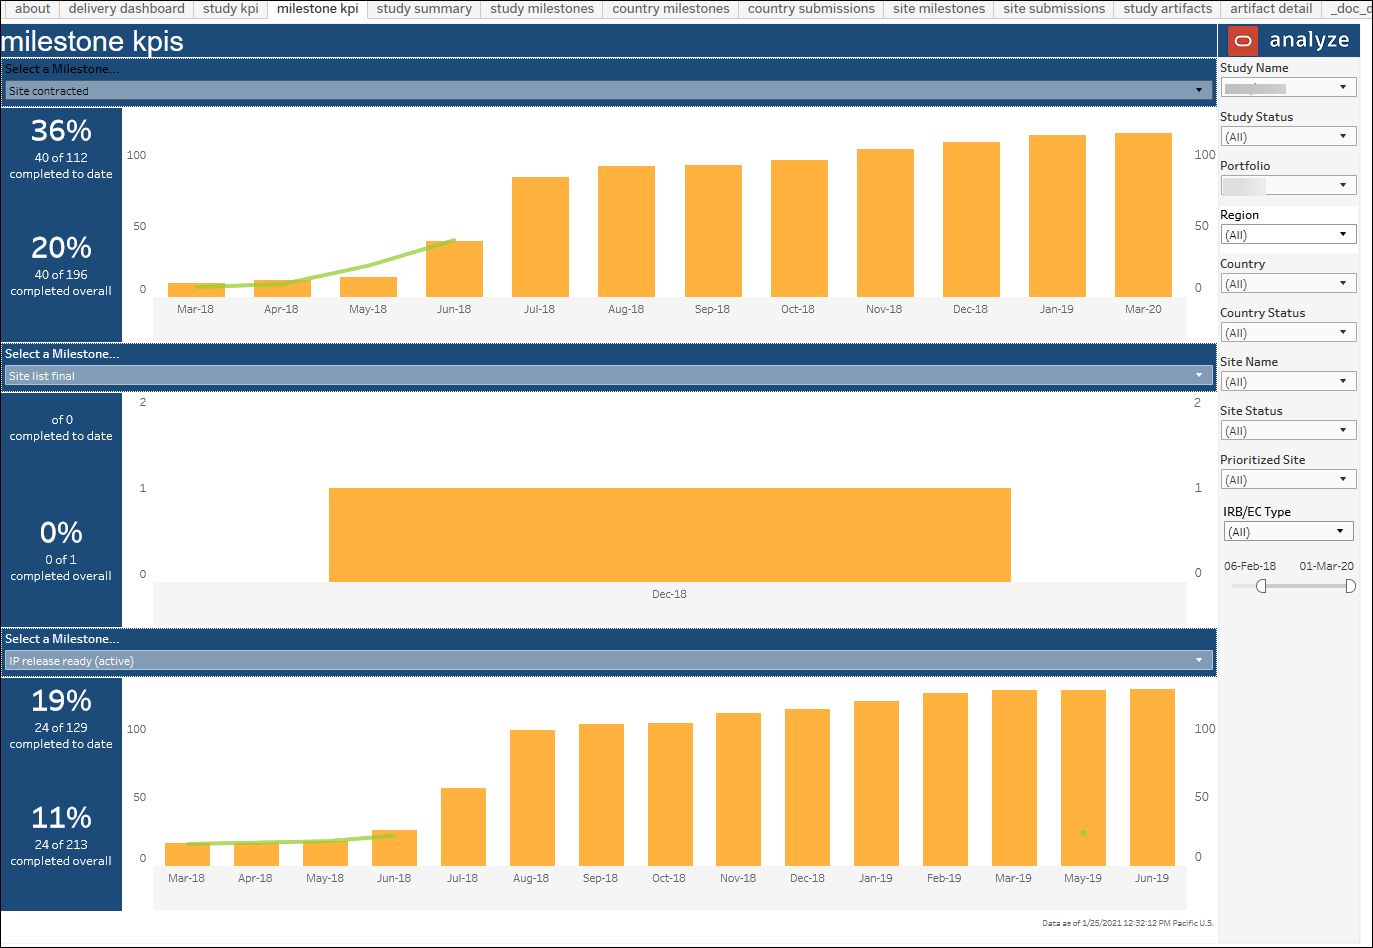
Milestone KPI Dashboard
The Milestone KPI dashboard allows comparison of up to three milestones at one time. Top level KPIs show:
- % planned to actual - total number of milestones completed divided by the total number of milestones planned up to the current day
- % actual to total - total number of milestones completed divided by the total number of milestones created
Study Summary
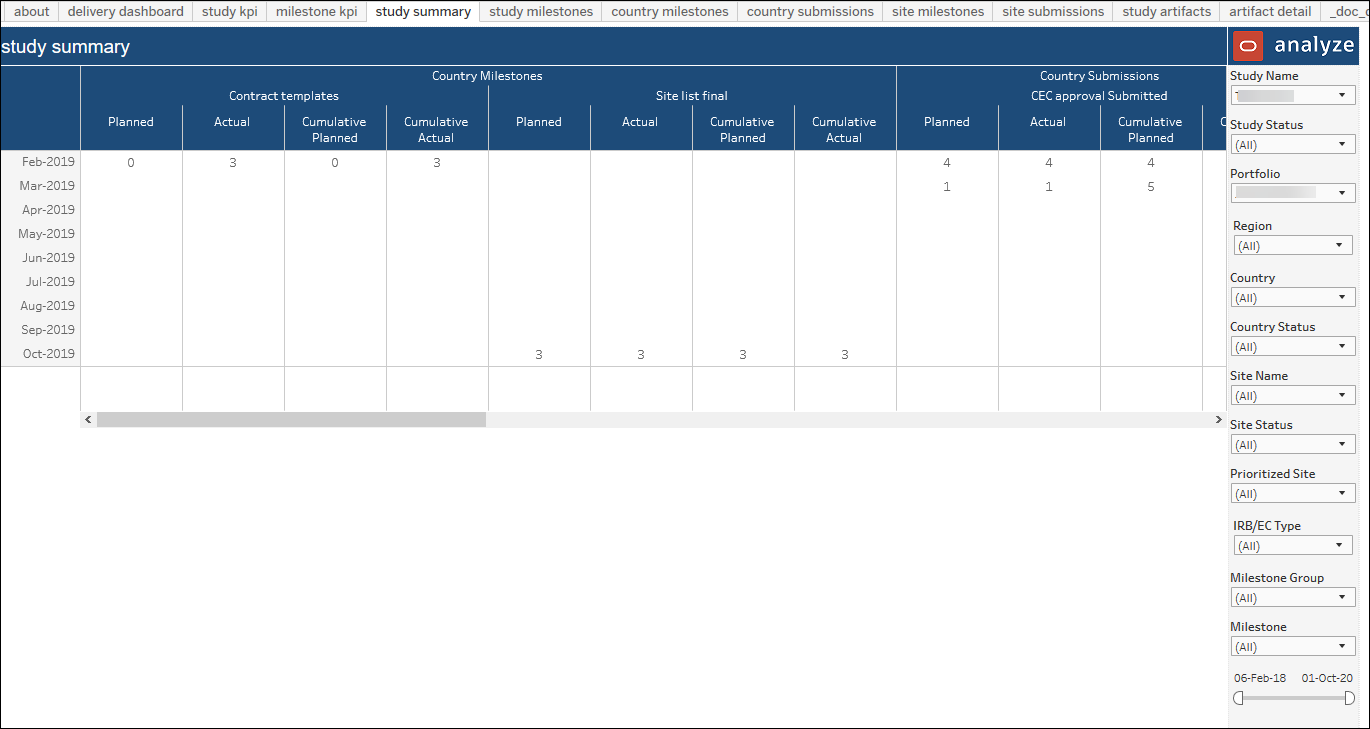
This worksheet provides a detailed tabular view of country and site global milestones, broken down by month, over the length of the study to date. This data is a detailed representation of the high-level graphical representation in the Study KPI dashboard.
You can filter this worksheet for a particular global milestone, or for any number of global milestones. This dashboard can also be filtered to look at data for the duration of the study to date, or other date range.
Study Milestones
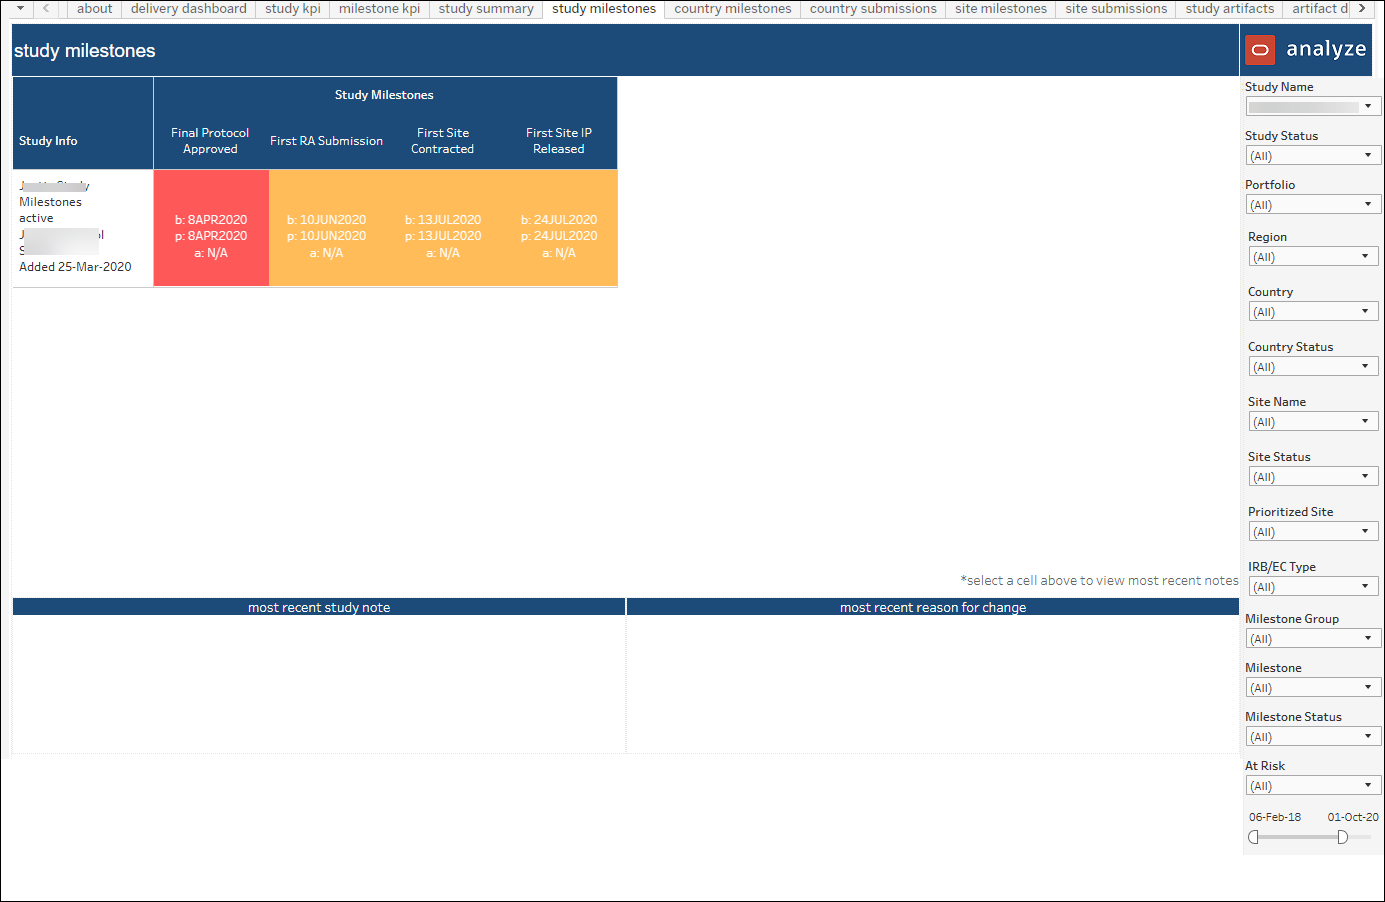
The Study Milestones dashboard worksheet allows you to review milestones at the study level. The worksheet is intended to help you understand if the study is on track.
Country Milestones
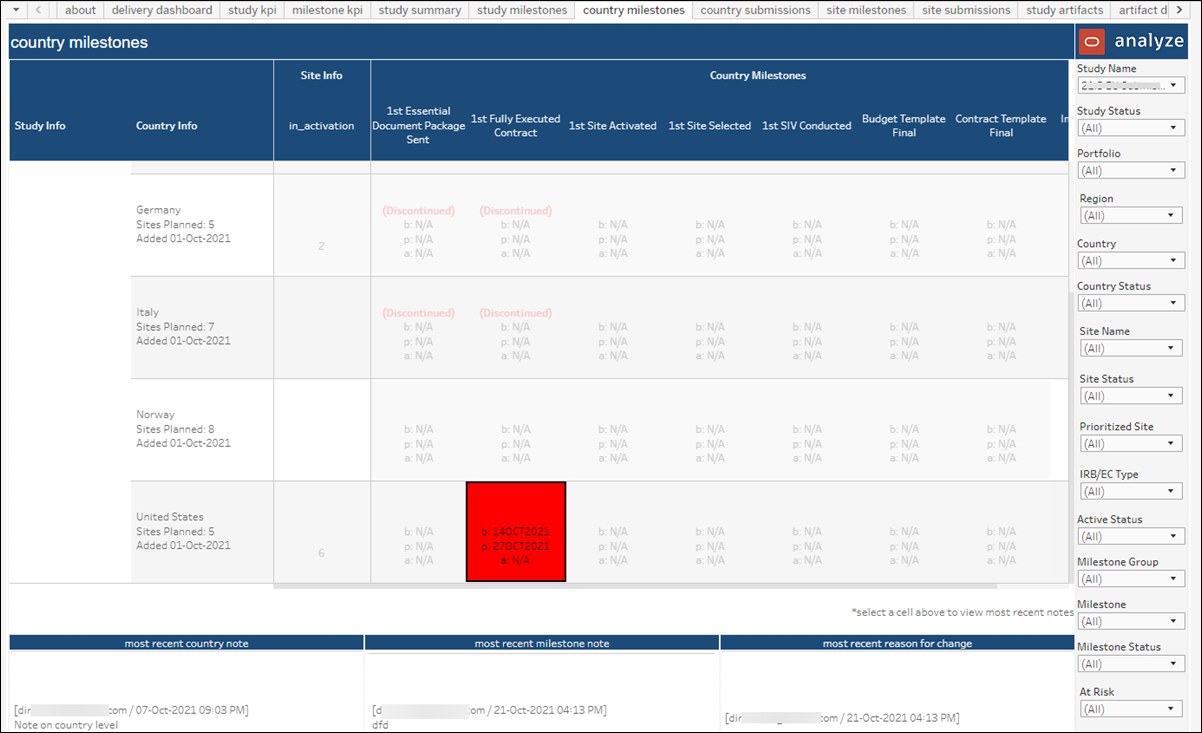
This sheet details country milestone data by site and milestone dates. Hover over tool tips (over the red and green boxes) provide additional information, such as "Latest re-plan note," if appropriate. The sheet provides multiple data filters llike Study Status, Portfolio, Study Name, Country, Active Status, Milestone Group, Milestone, Milestone Status, and date range.
You can also access notes related to country milestones on this sheet.
- Click on a country milestone and the most recent country note, most recent milestone note, and most recent reason for change note will display at the bottom of the dashboard
- Click on a country name and a link will display in the tool tip that you can click on to be taken the All Notes worksheet, which will display all notes for that country
- Click on a country name and a link will display in the tool tip that you can click on and be taken the All Notes worksheet, which will display all notes for the country milestones
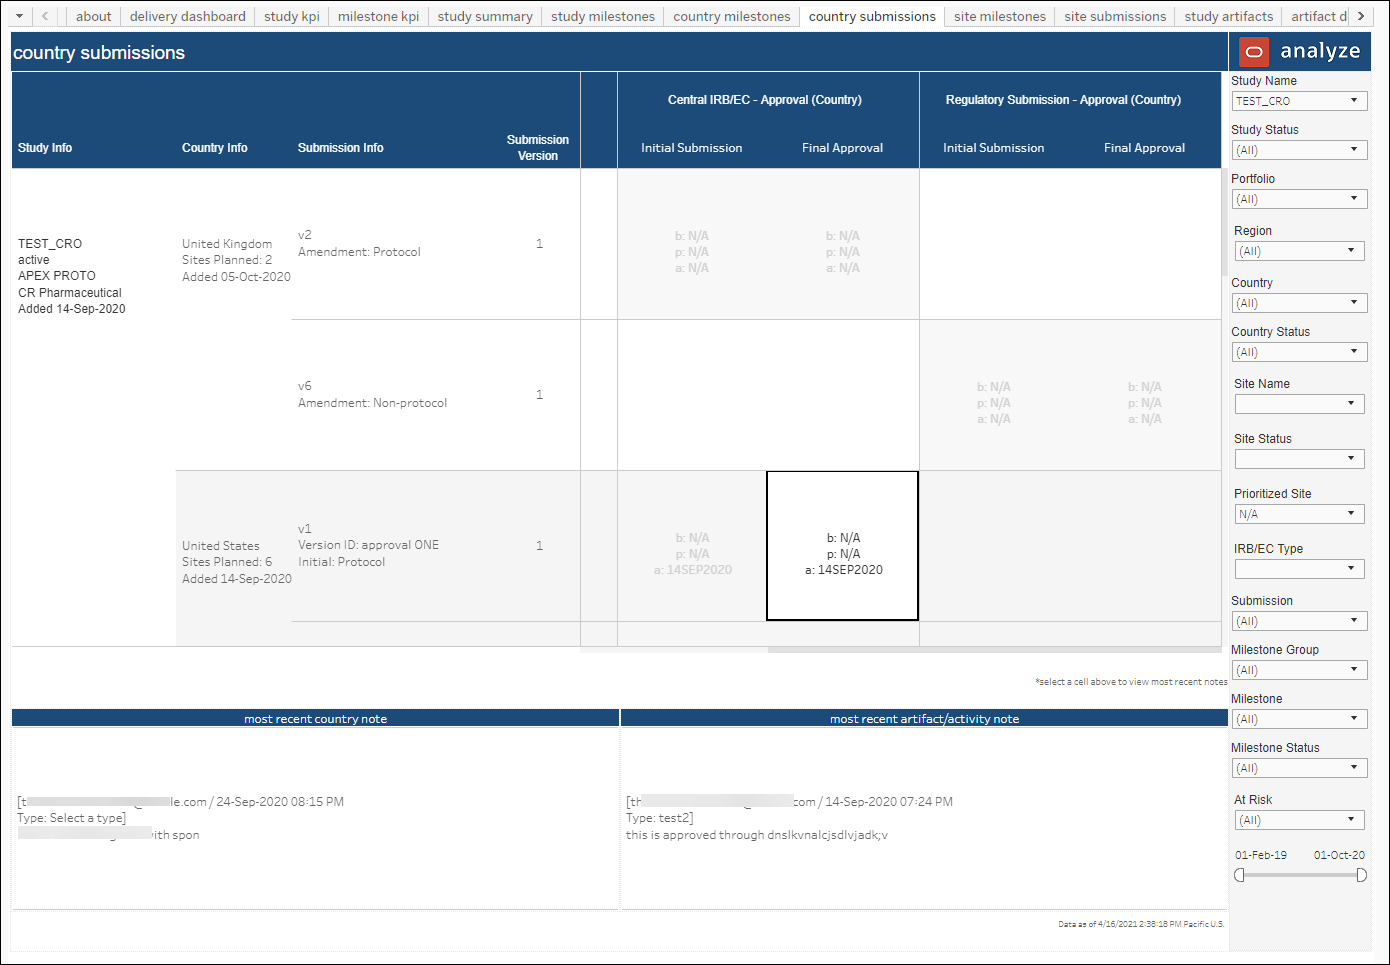
Country Submissions
This dashboard details study country regulatory submissions data. Hover over tool tips (over the red and green boxes) provide additional information, such as "Latest re-plan note," if appropriate. You can filter this sheet by Study Status, Portfolio, Study Name, Country, Submission, Milestone Group, Milestone, Milestone Status, and date range.
You can also access notes related to country submissions on this sheet.
- Click on a country submission and the most recent artifact/activity note related to that submission and the most recent country note will display at the bottom of the dashboard
- Click on a country name and a link will display in the tooltip that you can click on to be taken the All Notes worksheet, which will display all notes for that country
- Click on a country name and a link will display in the tooltip that you can click on and be taken the All Notes worksheet, which will display all notes for the country submissions
Site Milestones
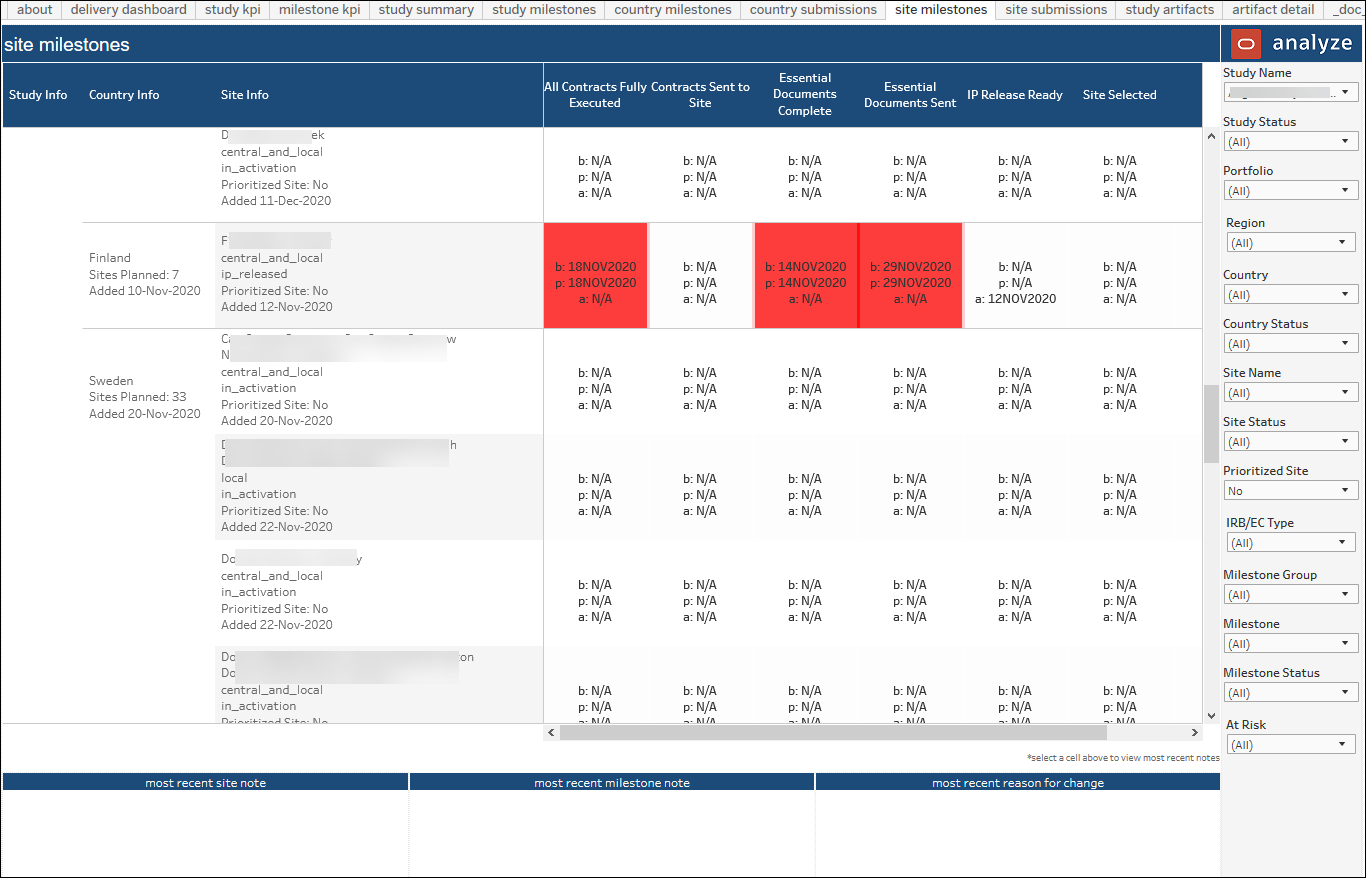
This worksheet details completed and past due milestones at the site level. Hover over tool tips (over the red and green boxes) provide additional information, such as "Latest re-plan note," if appropriate. You can filter this sheet by Study Status, Portfolio, Study Name, Country, Site Status, Site Name, Milestone Group, Milestone, Milestone Status, and date range.
You can also access notes related to site milestones on this sheet.
- Click on a site milestone and the most recent site note, milestone note, and reason for change will display at the bottom of the dashboard
- Click on a site name and a link will display in the tool tip that you can click on to be taken the All Notes worksheet, which will display all notes for the site
- Click on a site and a link will display in the tool tip that you can click on and be taken the All Notes worksheet, which will display all notes for the site milestones
Site Submissions
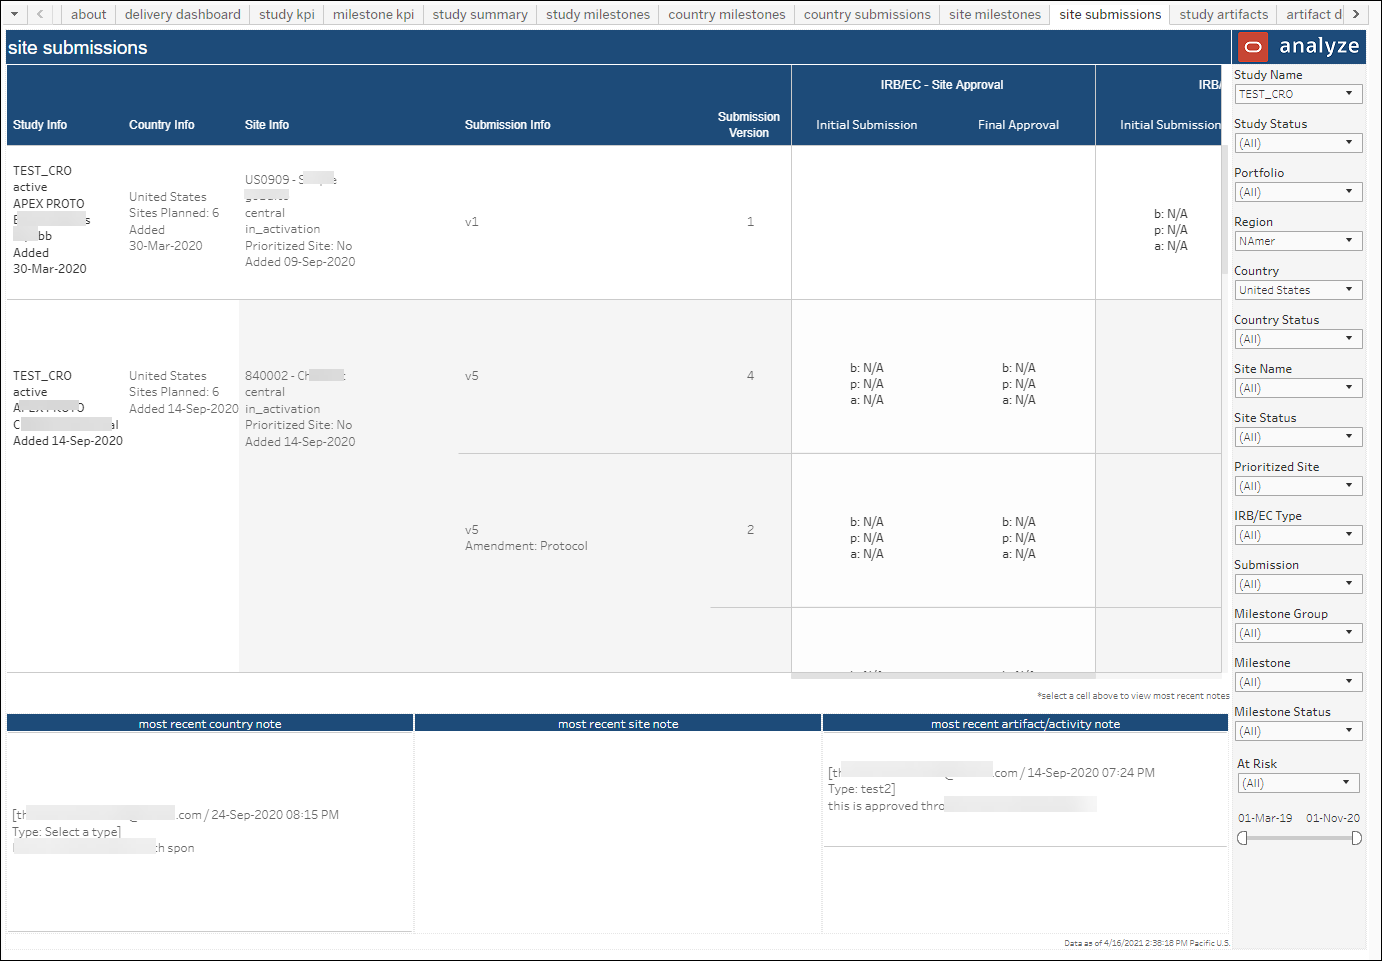
This worksheet details completed and past due submissions at the site level. Hover over tool tips (over the red, green, and white boxes) provide additional information, such as "Latest re-plan note," if appropriate. You can filter this sheet by Study Status, Portfolio, Study Name, Country, Site Status, Site Name, Submission, Milestone Group, Milestone, Milestone Status, and date range.
You can also access notes related to site submissions on this sheet.
- Click on a site submission and the most recent artifact/activity name and the most recent site and country notes will display at the bottom of the dashboard
- Click on a site name and a link will display in the tool tip that you can click on to be taken the All Notes worksheet, which will display all notes for the site
- Click on a site and a link will display in the tool tip that you can click on and be taken the All Notes worksheet, which will display all notes for the site submissions
Study Artifacts
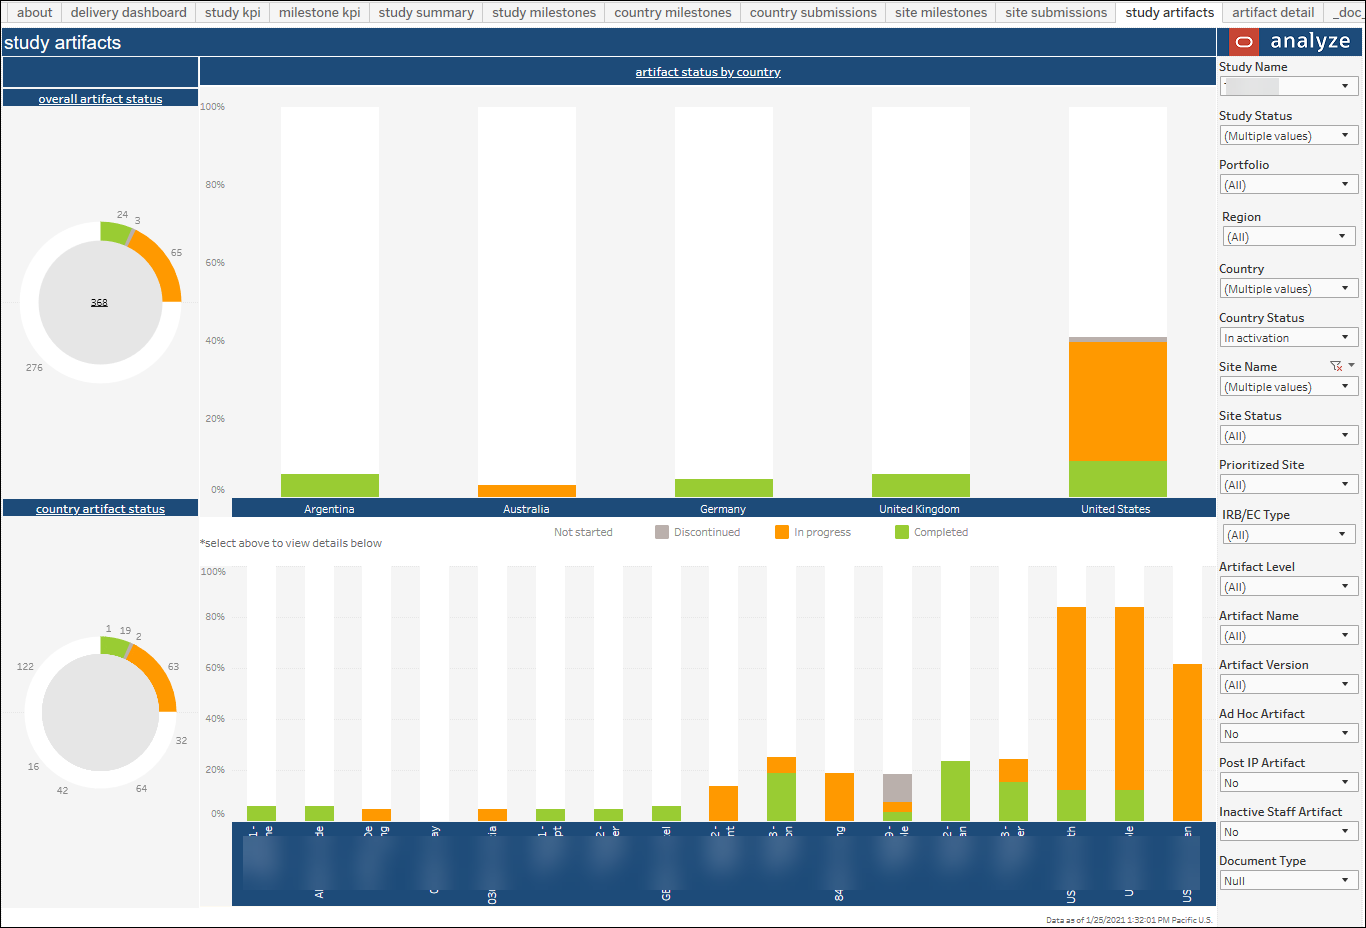
The Study Artifacts worksheet provides a comprehensive view of artifact status (e.g., total artifacts completed, % of artifacts completed, in progress, not started, and discontinued, etc.). You can drill into a Study Artifact Dashboard from the Country Milestones, Country Submissions, Site Milestones, and Site Submissions sheets. From the Study Artifact Dashboard, you can then drill into the Artifact Detail sheet.
Artifact Detail
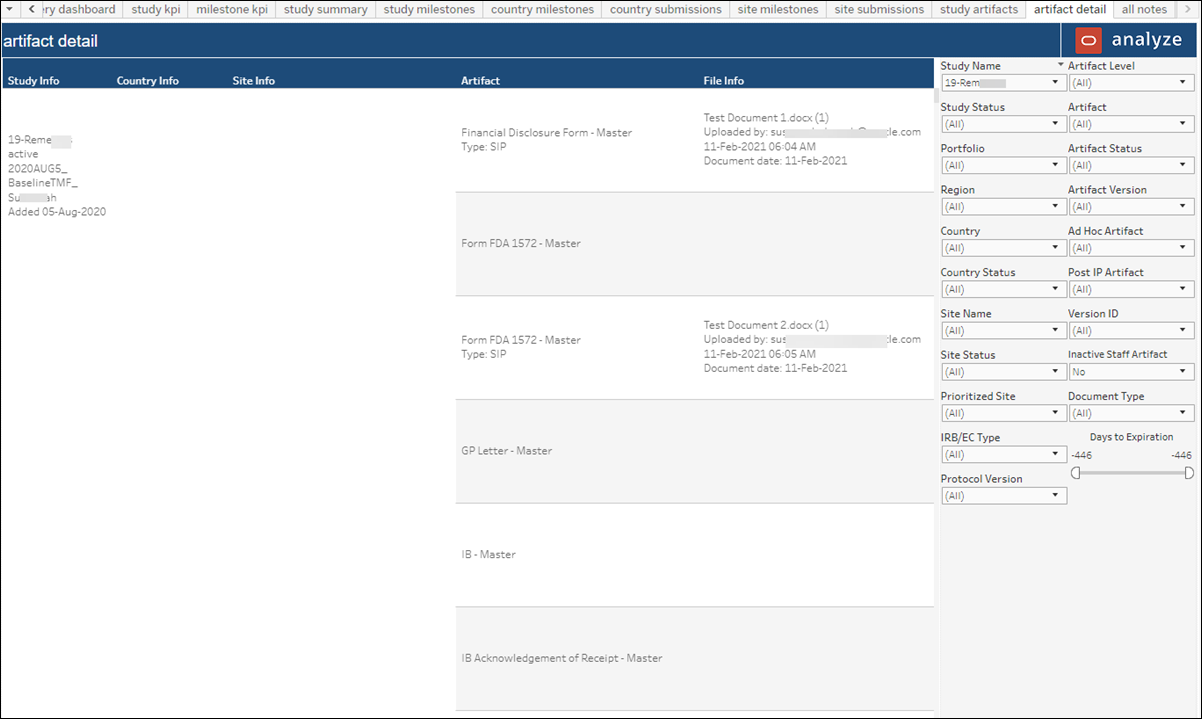
The Artifact Detail worksheet includes the status of each individual artifact at the site. The filter panel to the right side of the worksheet provides multiple options for subsetting artifacts. For instance, you can filter by Artifact, Artifact Status, Artifact Version, and more.
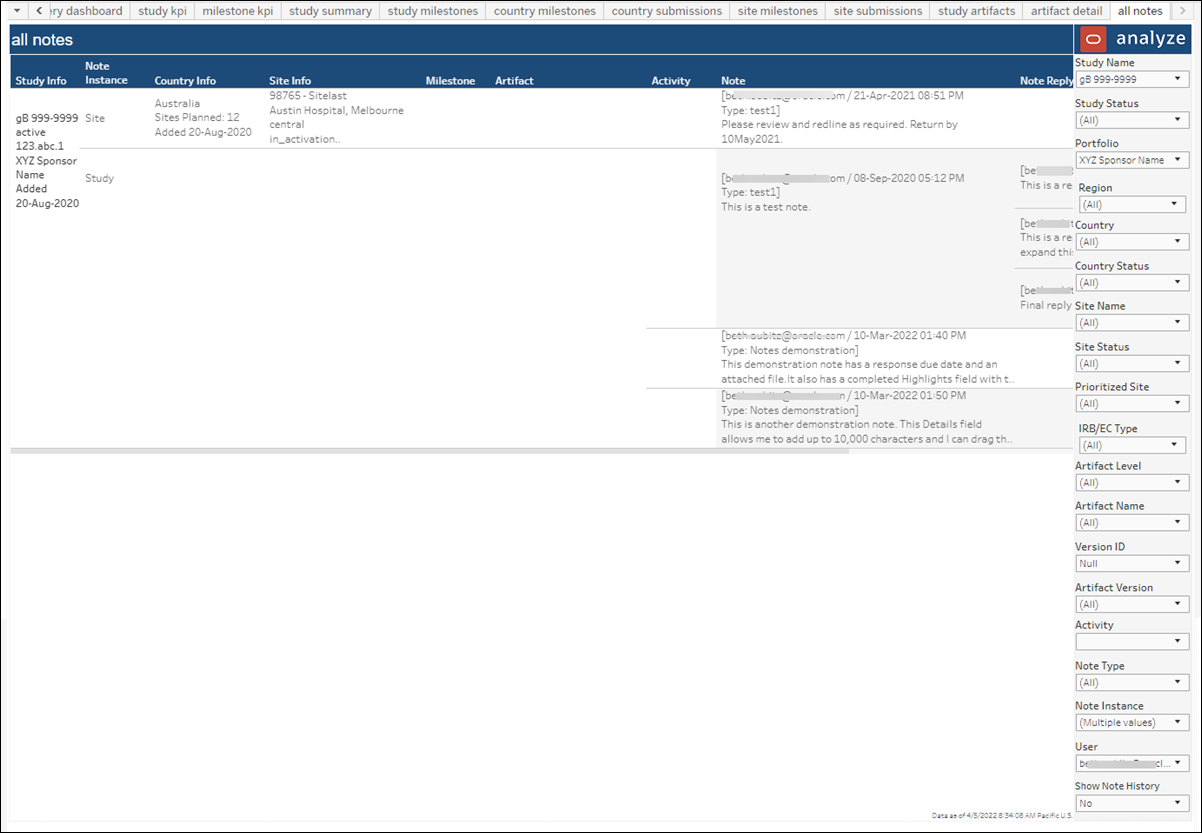
All Notes
The All notes worksheet includes detailed note text associated with study artifacts. Using the options in the filter panel to the far right, you can filter the All Notes worksheet by study status, portfolio, study name, country, site status, and more.
