7 Cycle Times
Workbook synopsis
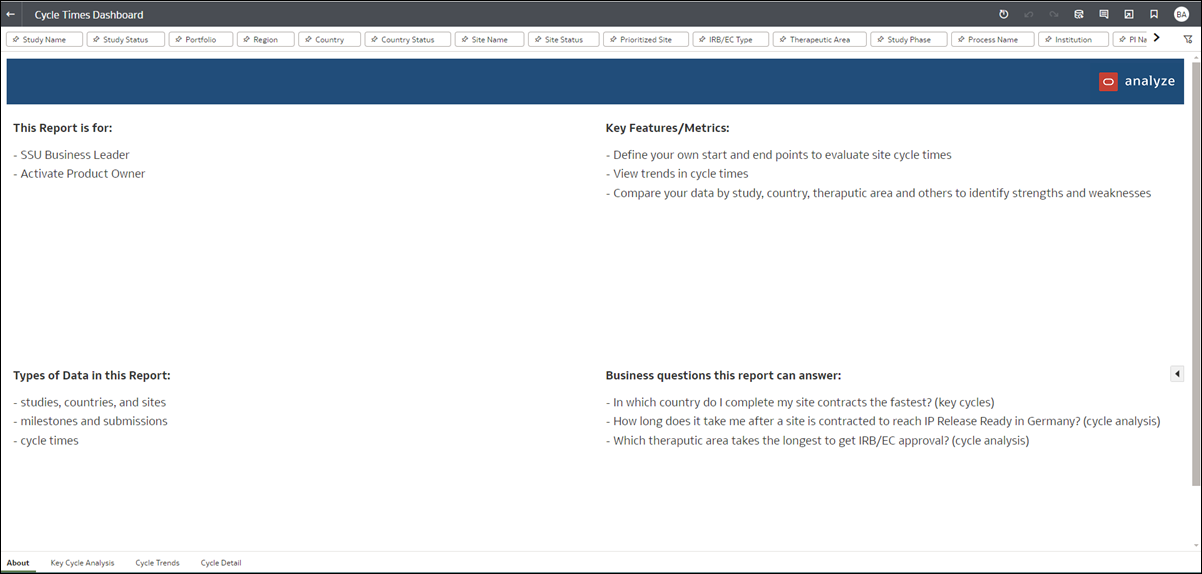
The Cycle Times Dashboard, which is intended for Oracle Site Activate product owners and study startup business leaders, includes key cycle metrics with configurable cycle start and end points. The report includes data for studies created in the past three years.
Dashboards and sheets
About
- Study startup roles that would use the report
- Key report features and metrics
- Types of data the report contains
- Examples of how to use the report to answer a business question

Key Cycle Analysis
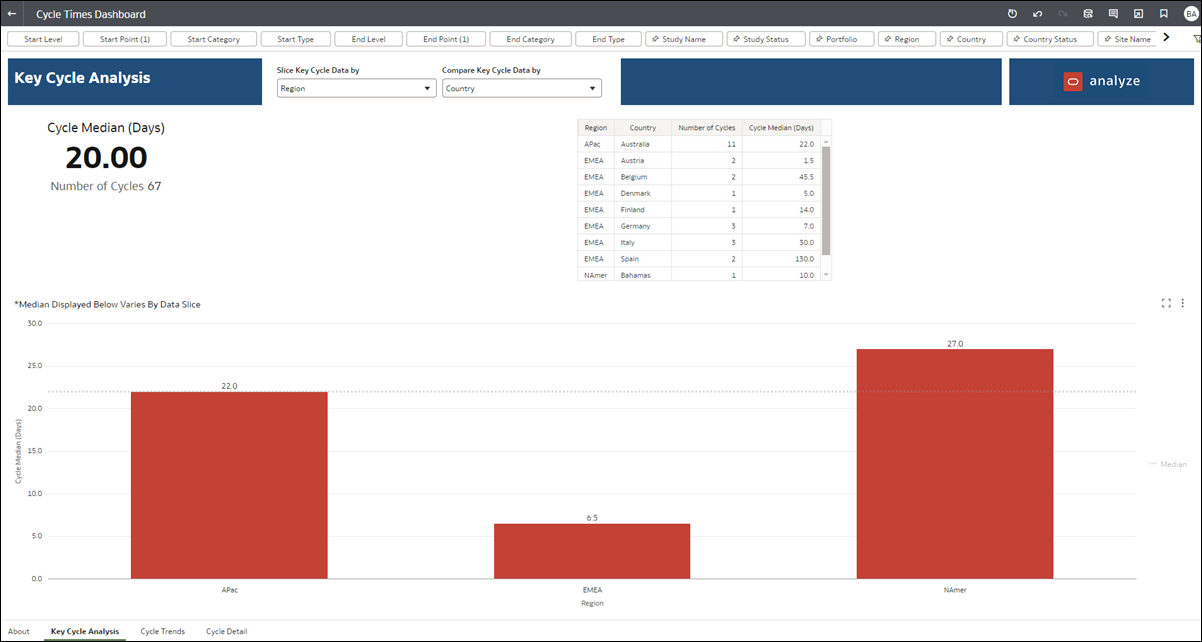
The Key Cycle Analysis dashboard provides insight into a single key cycle. Use the filters at the top of the worksheet to select one cycle to see the KPI, bar chart, and table for that cycle. In the report header, use filters to:
- Slice your data by: All, Region, Country, Study Name, CRO Study Name, Sponsor Study Name, Therapeutic Area, Study Phase, or PI Name
- Compare your data by: All, Region, Country, Study Name, CRO Study Name, Sponsor Study Name, Therapeutic Area, Study Phase, or PI Name
Hover over any point in the bar chart to see additional information in a tool-tip. This report also allows you to drill to the Cycle Detail worksheet for additional information. To drill, right-click on any cell in the table or any point in the bar chart, and select "View Cycle Detail" from the menu.

Cycle Trends
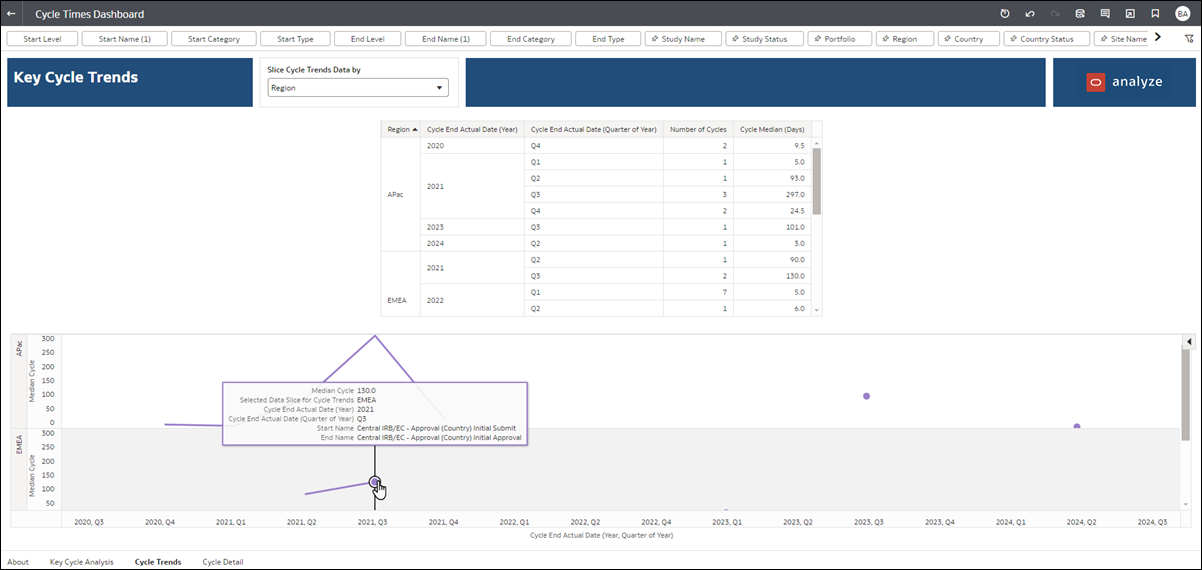
The Cycle Trends report simplifies viewing cycle performance over time. On this sheet, you'll use the filter in the report's header to slice data by All, Region, Country, Study Name, CRO Study Name, Sponsor Study Name, Therapeutic Area, Study Phase, or PI Name.
The worksheet's upper section presents the sliced data in a tabular format with columns for Country (sortable), Cycle End Actual Date (Year), Cycle End Actual Date (Quarter of Year), Number of Cycles, and Cycle Median (Days).
In the worksheet's lower section line chart, hover over tooltips provide additional details structured in bullet points. For instance, you'll see Cycle End Actual Date (Year), Cycle End Actual Date (Quarter of Year), Start Name, and End Name in the tooltips.

Cycle Detail
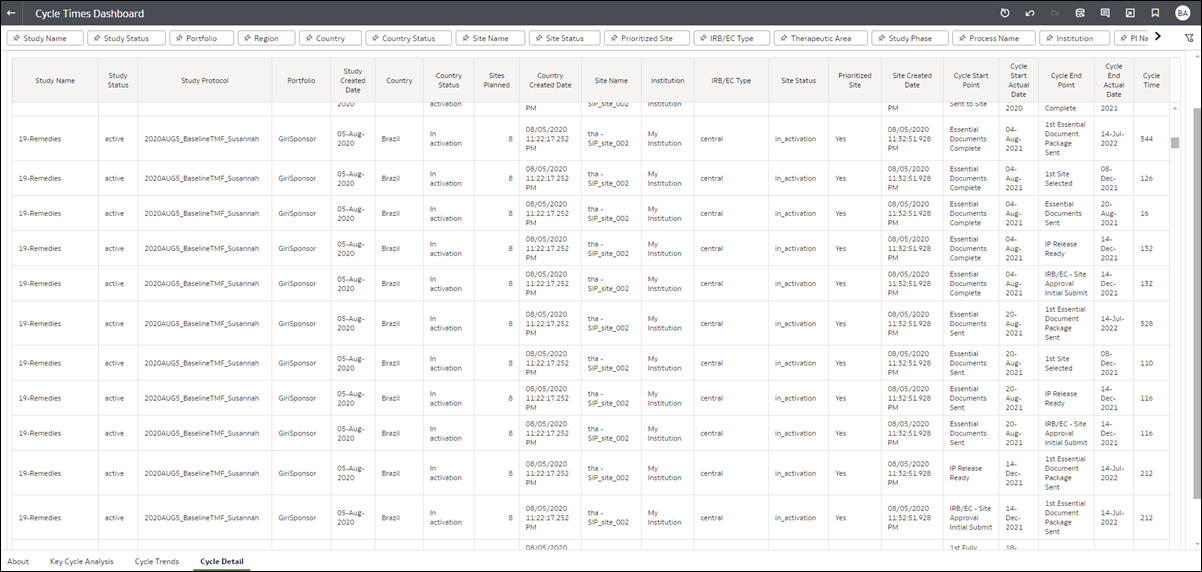
The Cycle Detail worksheet provides a tabular view of Study, Country, Site, and Cycle data. You can drill into the Cycle Detail sheet from the Key Cycle Analysis worksheet, if preferred. Right-click on the table cell or bar chart in the Key Cycle Analysis worksheet and choose "View Cycle Detail" from the menu.
