11 Planning Impact Analysis
Workbook synopsis
This report helps surface milestone change trends so you an quickly evaluate why milestone dates are being delayed.
Dashboards and sheets
Planning Impact Analysis dashboard
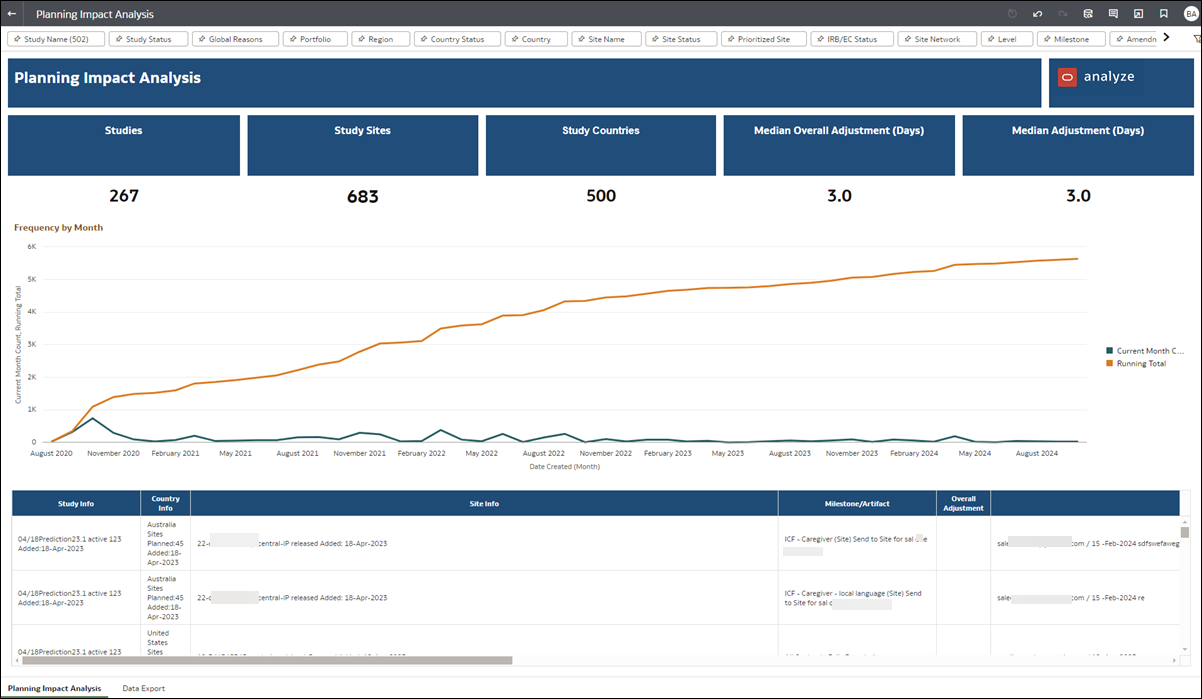
The top of the Planning Impact Analysis worksheet shows five Key Performance Indicators:
- Studies: number of unique studies in which the search word/term exists in notes and reason for change entries
- Study countries: number of unique study countries in which the search word/term exists in notes and reason for change entries
- Study sites: number of unique study sites in which the search word/term exists in notes and reason for change entries
- Median overall adjustment (days): the difference in the planned date versus prior planned date for the reason for changes that text match to the search word/term (accounts for multiple replans)
- Median adjustment (days): the difference in the planned date versus prior planned date for the reason for changes that text match to the search word/term (accounts for distinct replans)
The center of the dashboard is a frequency trend line chart with two lines. One line shows distinct appearances of keyword(s) by month, while the other line shows cumulative appearance of keyword(s) by month.
The dashboard's lower section presents the following information in a tabular format:
- Study information
- Country information
- Site information
- Milestone/artifact
- Overall adjustment
- Notes/reasons
- Plan

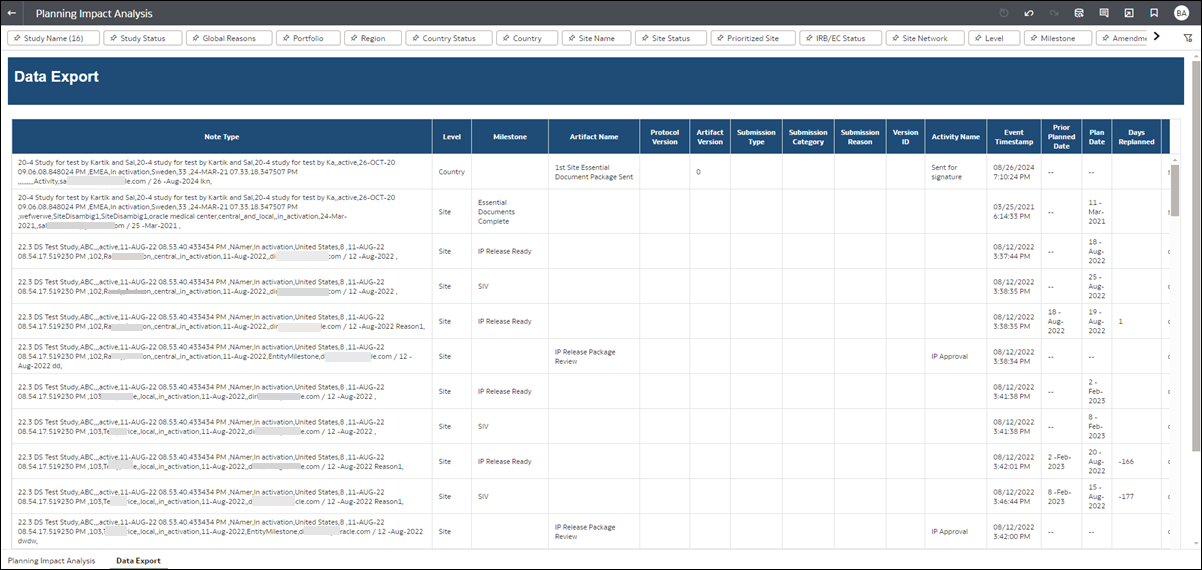
Data Export
If preferred, you can export the report's content using the Data Export worksheet. As with all Oracle Site Analyze reports, a wide variety of filters are provided at the top of the worksheet that allow you to subset data to your preferred view.
