2 Account Metrics
Workbook synopsis
The Account Metrics report workbook, which is intended for Oracle Site Select customers, includes dashboard views of studies, sites, and Oracle Site Select users as well as detailed cross-tab sheets of each.
Dashboards and sheets
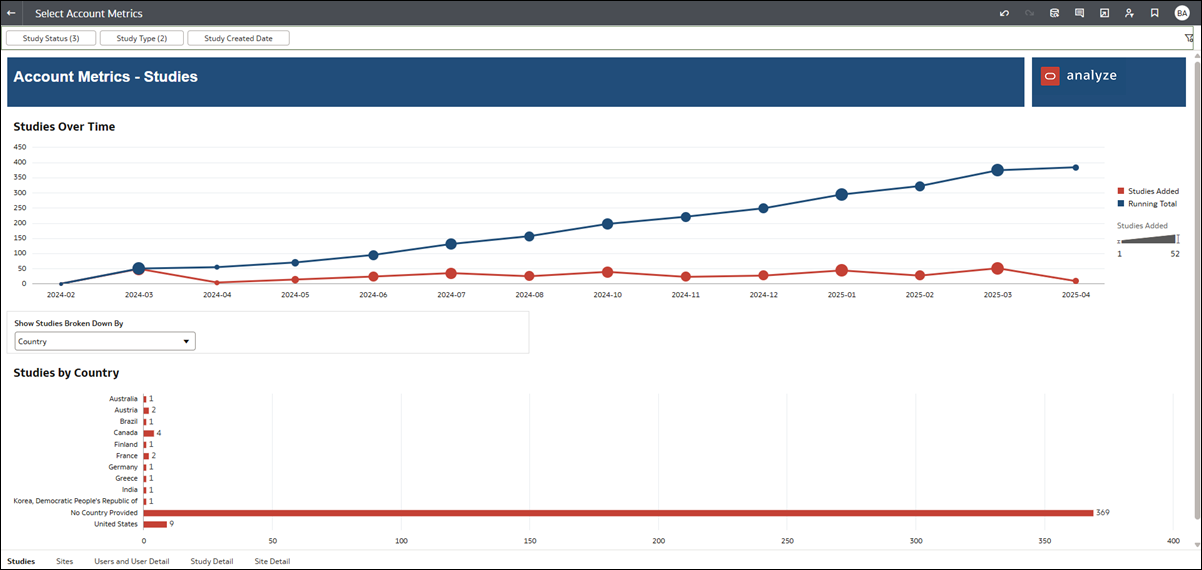
Account Metrics - Studies
The studies dashboard shows trends in studies that have been added to Oracle Site Select over time. The top portion of the dashboard includes trending and running total line graphs indicating the number of studies added per month.
Use the worksheet filters (Study Status, Study Type, and Study Created Date), along the top of the dashboard, to include/exclude data from the dashboard view. Use the "Show Studies Broken Down By" filter, at the center of the worksheet, to change the dimension (country, sponsor, or phase) displayed in the lower section of the dashboard.
Account Metrics - Sites
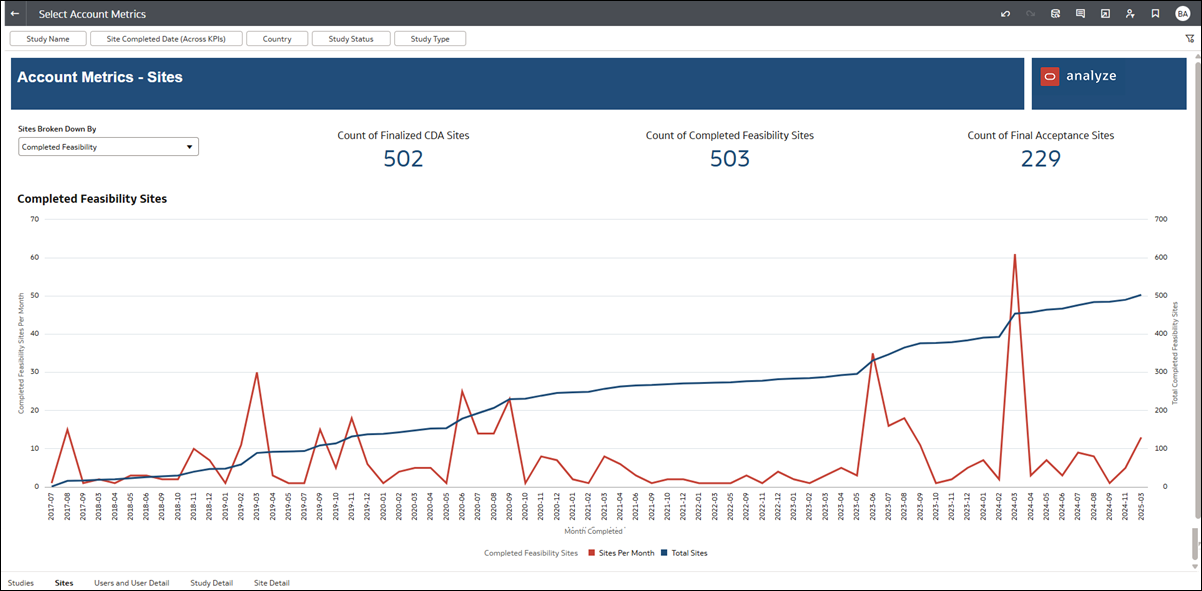
The sites dashboard shows you trends in sites that have completed important milestones in Oracle Site Select over time. Top level KPIs show total number of study sites that have finalized CDAs, total number of study sites that have completed feasibility, and total number of study sites that have reached final acceptance bucket state. A running total line graph indicates total over time and a month-by-month line graph indicates distinct number per month.
Use the filter options along the top of the worksheet to limit the scope (e.g., choose a specific Study, Site Completed Date, Country, Status, or Type.) and tailor the available data to your preferred view.
Account Metrics - Users and Users Detail
This dashboard shows top level KPIs for total Oracle Site Select users added and users added last month. The Total Users and Users Added Running Total visualization shows the cumulative users over time and users added for each month. Hover over any point in the line graphs to see additional details. The "Status" filter at the top of the worksheet makes it easy to toggle between including/excluding inactive users in the aggregations.
The users detail table at the bottom of the worksheet shows details based on the filters you specify from the options at the top of the worksheet. For example, filter by date range for Oracle Site Select user account creation and last login. You can also specify if you want to include users who have never logged in and/or view the data by active, inactive, or all users.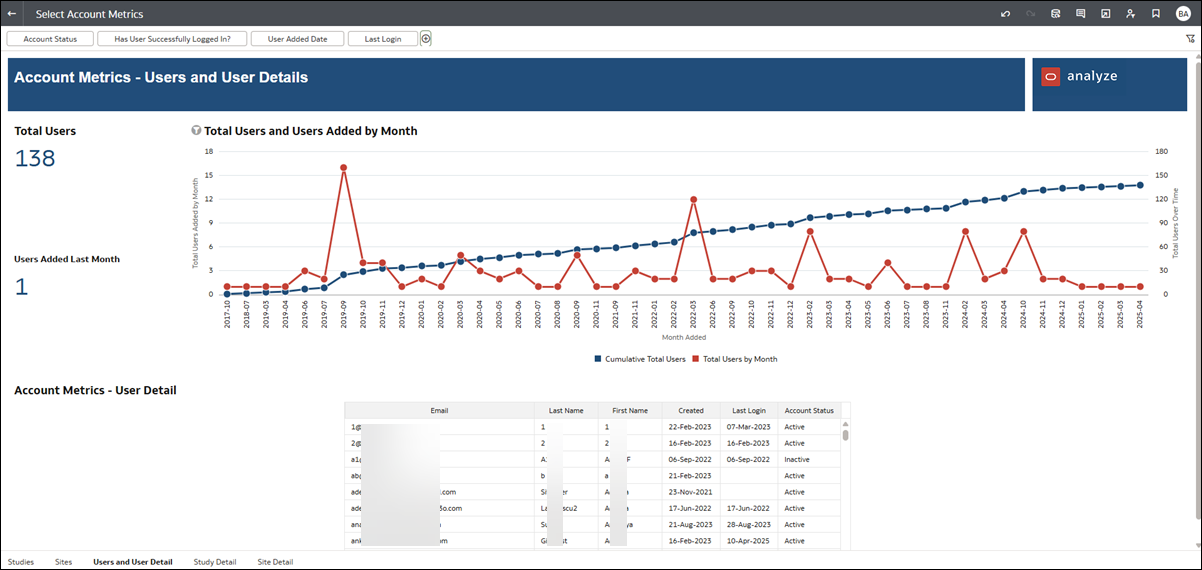
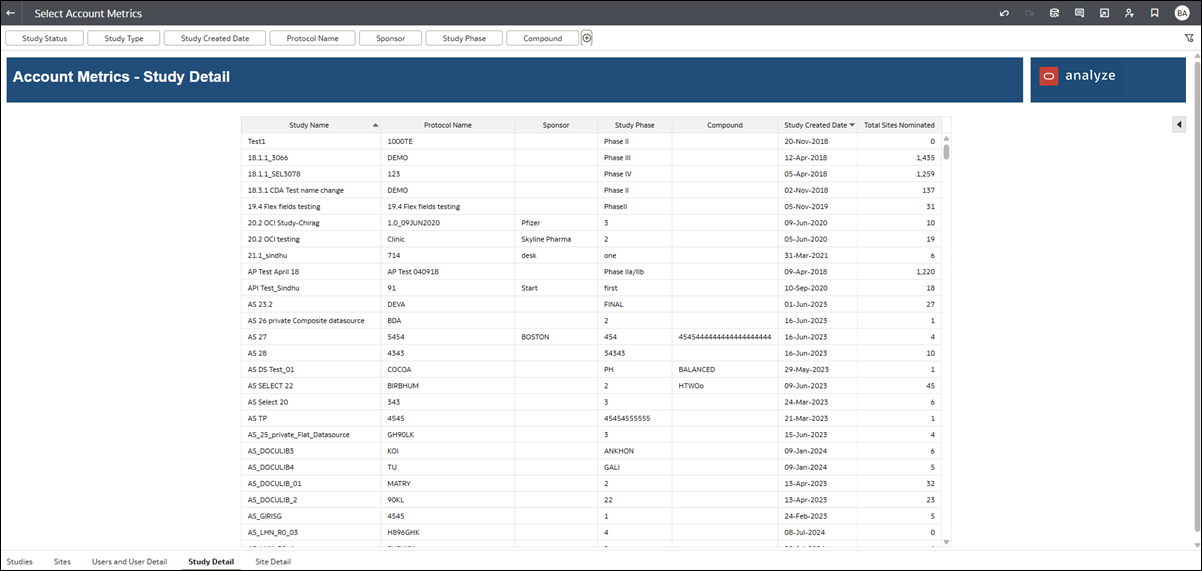
Account Metrics - Study Detail
The study detail worksheet lets you filter details by study status, study creation date, protocol name, sponsor, study phase, and/or compound. You also have the ability to drill directly to site data by clicking on any study listed in the "Study Name" column.
Account Metrics - Site Detail
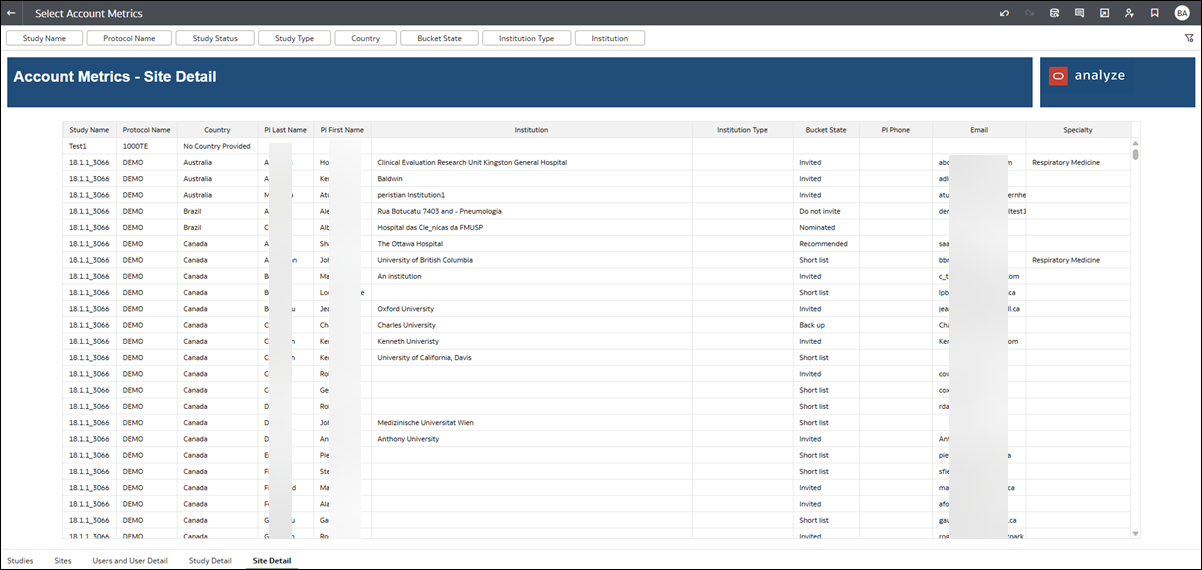
The sites detail worksheet lets you filter details by study, country, bucket state (e.g., do not invite, invited, short list, etc.), and more.
