Navigating in Oracle Site Select
The application provides global menus, links, and dashboards that allow you to transition between views and pages.
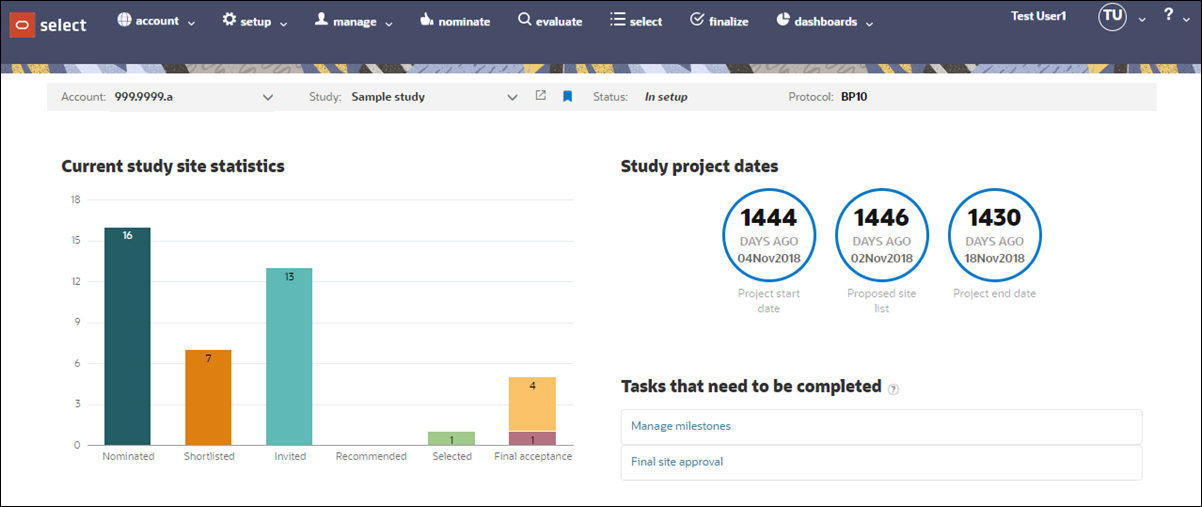
A persistent global navigation menu displays at the top of every page. Site selection mode and menu options available to you (e.g., setup, manage, nominate, etc.) depend upon your role and the permissions granted for your user account. Oracle Site Select controls which options display within the global navigation drop-down menus based on permissions granted for your user account. This means that you might have access to the "setup" drop-down menu, but the menu will include only those actions you have permission to access.
At the far right of the global navigation menu, click the drop-down menu to the right of the circular profile icon to access your user profile settings. To access product or API documentation or the Oracle support home page, click the down arrow to the right of the question mark.
You'll see another persistent menu below the global navigation menu where you can navigate between accounts and studies depending on your assigned permissions and studies. If you've been assigned to multiple studies, you can optionally favorite your frequently accessed studies by clicking the bookmark (![]() ) to the right of the study name. Your favorite studies automatically sort to the top of the Studies drop-down list. Just click the bookmark again to unfavorite any study. If you have user permission to view other studies, use the Study drop-down to choose a different study. The Study drop-down supports type-ahead search logic.
) to the right of the study name. Your favorite studies automatically sort to the top of the Studies drop-down list. Just click the bookmark again to unfavorite any study. If you have user permission to view other studies, use the Study drop-down to choose a different study. The Study drop-down supports type-ahead search logic.
The study home page includes bar charts, milestone visualizations, and a task list to help you track study progress and tasks you need to complete. The bucket state bar charts show the aggregate number of study sites placed in each represented bucket state over time. Recommended, Selected, and Final Acceptance bar charts display stacked values when available. Hover over the bar charts to see detail.

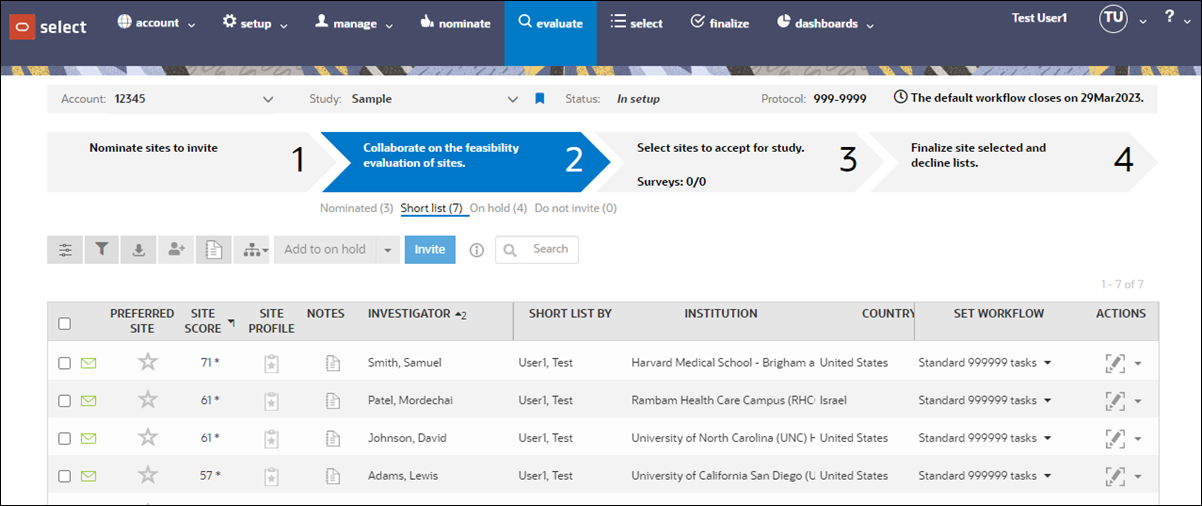
If you perform site selection tasks, you can quickly switch between nominate, evaluate, select, and finalize modes by clicking the chevron arrows above the site grid. Blue indicates the current mode (for example, in the image below, the current mode is Evaluate). You can also see the highlighted "evaluate" option in the global navigation at the top of the page. You can change modes using the options in the global navigation rather than clicking the chevron arrows if you prefer.

The global navigation Dashboards menu provides access to site status dashboards, reporting options, and the myDashboard study-level dashboard feature. Access to each dashboard menu item is permission-based, so you may see some or all options.
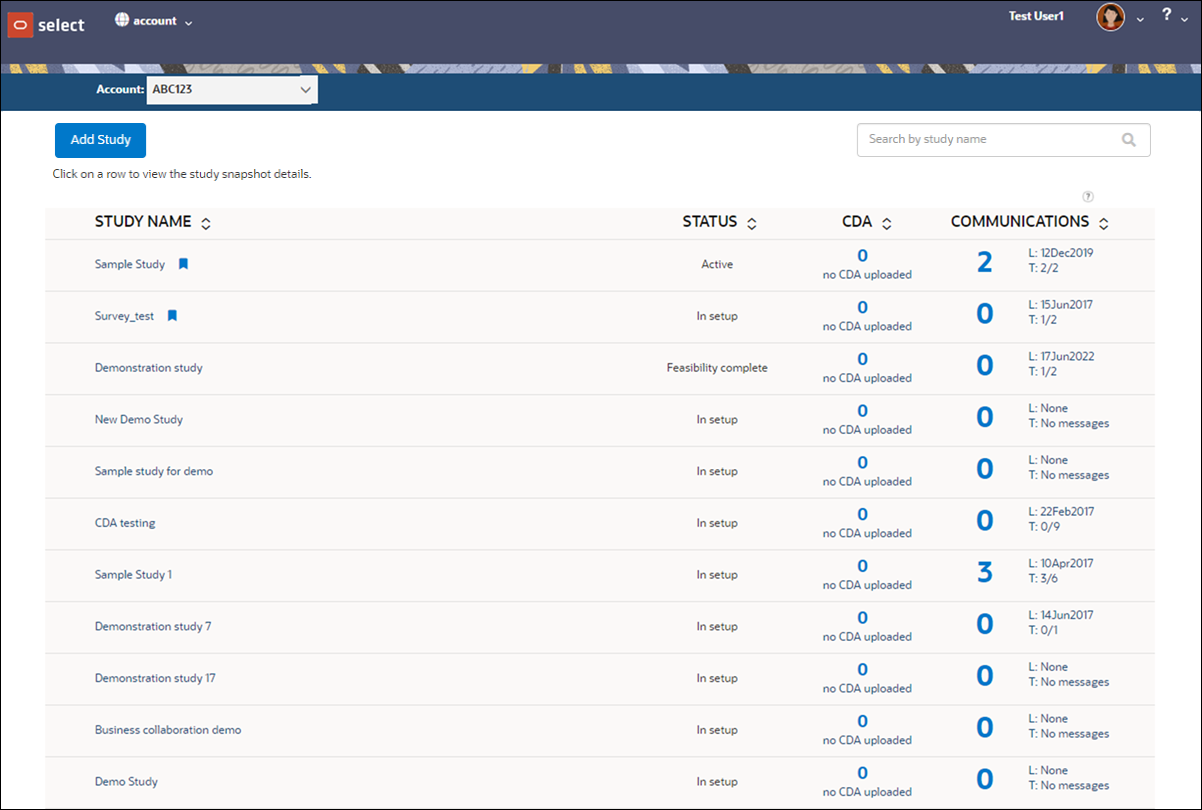
The myDashboard feature (accessed from the Dashboards menu) provides a study grid that provides quick views into the progress of sites in the study and insight into study communications and pending CDAs. Click any linked study name to navigate to that study's home page. You can interact with that study as usual and favorite the study if preferred. Your favorite studies sort to the top of the study grid (alphabetically among any other favorite studies).
Your user account permissions also affect the display of other menu or action items on the myDashboard page. For example:
- If you have an account administrator permission (such as user management), you can see the global "account" menu, and the menu has all items you have permission to use.
- Suppose you have a Business Partner collaboration study permission. In that case, you can see an Accounts drop-down list just above the study grid, and you can choose any permissioned account on the list to view on myDashboard.
- When you have Account study creation permission, you'll see an Add Study action button above the study list. Just enter a unique study name and ID to create the study within the account, and you'll see a confirmation when successful. After creation, the new study's home page displays and includes a "Manage study details" task link to provide quick access to the first step in new study setup.
When viewing the myDashboard study grid, if you click the "select" logo at the top left, the grid automatically displays the previous study's home page if in session. If no study is in session and you click the logo, the most recent study visited displays.
A sortable CDA column shows the count of actionable CDAs (those in Requires review or Final review status) and the date of the last CDA uploaded for a site assigned to you. The CDA column design brings higher visibility to these documents, as they can be challenging to track as they progress from submission to approval. When the CDA count is "1" or above, you can click the count and navigate to the country page for the most recently received CDA.
The Communications column to see if unread messages might need to be addressed. This column reflects multiple totals; the number shown to the left of the communication totals is the total unread communications from sites assigned to you for the study. The stacked numbers on the right are:
L = Date last message received from a site in the study
T = Total unread messages from sites in the study / Total messages received from sites in the study.

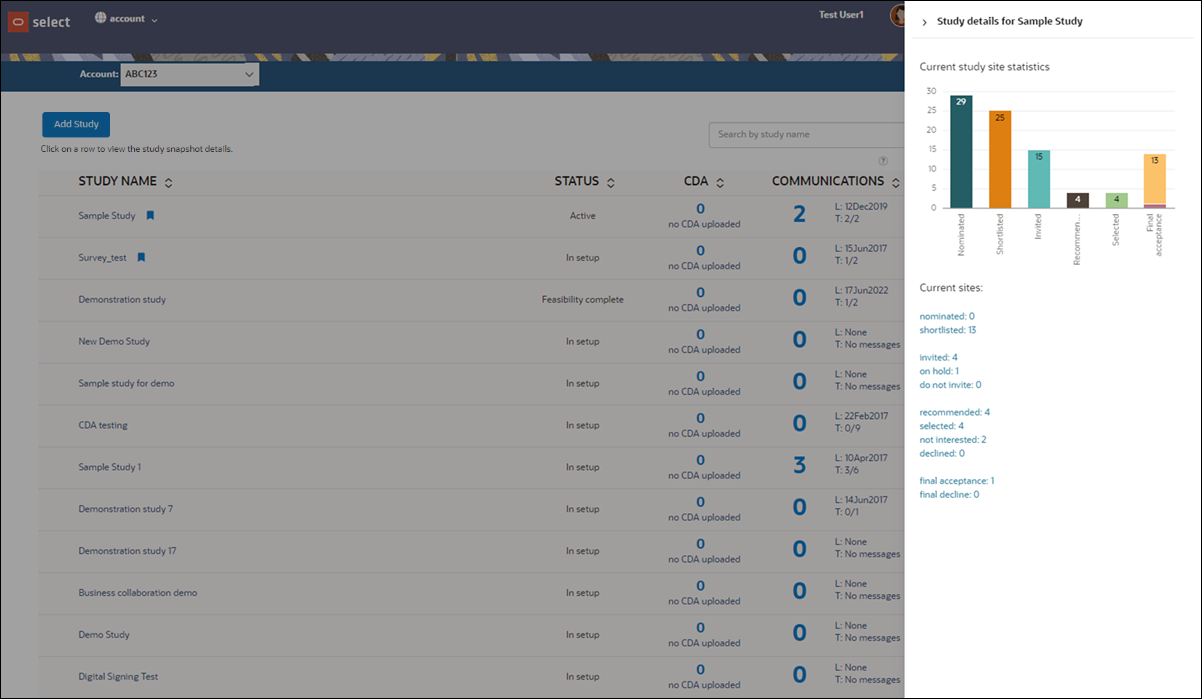
myDashboard also includes a study details drawer component that opens from the right side of the page when you click on a study row. From top to bottom, the drawer displays:
- Study site statistics (the same progress visualization you see on that study's home page)
- Study details which is an expandable accordion list of values saved on the Study details page. This section can display:
- Study ID
- Protocol number
- Study type
- Study sponsor
- Study internal description
- Study internal ID
- Study internal status
- Study owner
- Study partner ID
- Current site counts by bucket state. Click to navigate directly to any listed bucket state.

Parent topic: Navigation