Email invitations
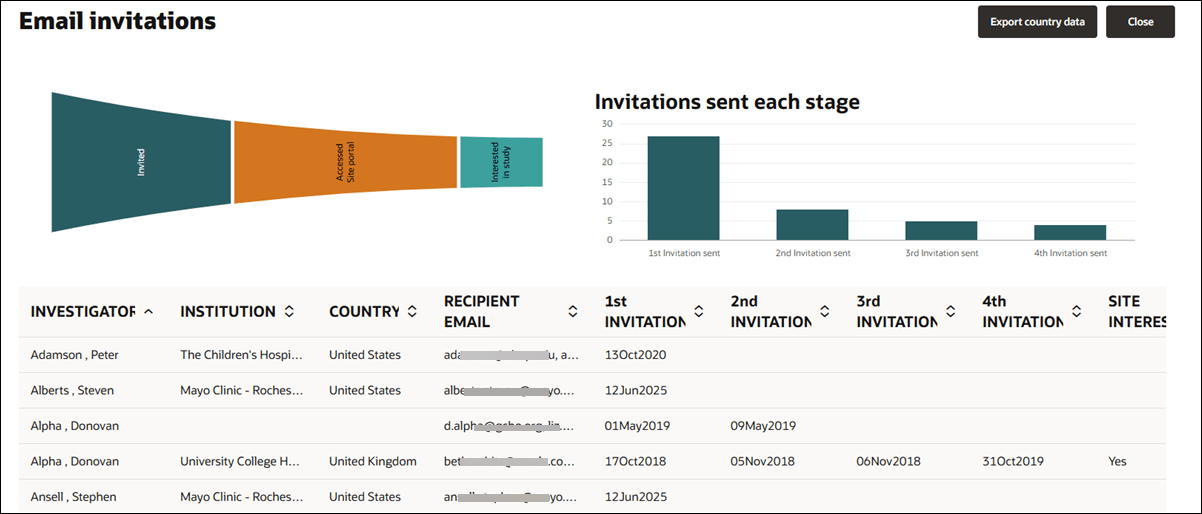
The Email invitations dashboard provides a convenient place to review the status and outcome of a study's invitations in graphical and tabular formats.
If you have a role with View Dashboards permission, you'll find the Email invitations dashboard in the global menu's ![]() Dashboards section. The dashboard includes a funnel chart that shows invited sites, sites accessing the portal, and sites expressing interest. The funnel chart has a clear legend and hover text for each section. a list of sites that received study invitation emails, the date the initial and subsequent invitations were sent, and if the site indicated interest in participation.
Dashboards section. The dashboard includes a funnel chart that shows invited sites, sites accessing the portal, and sites expressing interest. The funnel chart has a clear legend and hover text for each section. a list of sites that received study invitation emails, the date the initial and subsequent invitations were sent, and if the site indicated interest in participation.
You’ll also see a bar graph at the upper right that shows the number of invitations sent per stage (i.e., 1st, 2nd, 3rd, and 4th invitation) and a table listing invited sites with their invitation and re-invitation dates (i.e., track up to four invitations total). At the upper right, click the "Export country data" button to export the table data to CSV, and click "Close" to return to the study home page.

- View a site's invitation status
The Email invitations dashboard lets you track up to four invitation attempts for a site in your study. - Resend study invite to one or more site(s)
Use the Resend Invite option in the site grid's Invited bucket state to resend a study invite to selected site(s). - Resend study invite to site or representative
Use the resend option in a site's details drawer to send another study invite to the site or their representative.
Parent topic: Dashboards