My Dashboard
The study level My Dashboard feature gives you multiple options to access and navigate your studies.
In the global menu ![]() Dashboards section, you'll see a My Dashboard option. You can also access your My Dashboard view by clicking the logo
Dashboards section, you'll see a My Dashboard option. You can also access your My Dashboard view by clicking the logo ![]() in the page header.
in the page header.
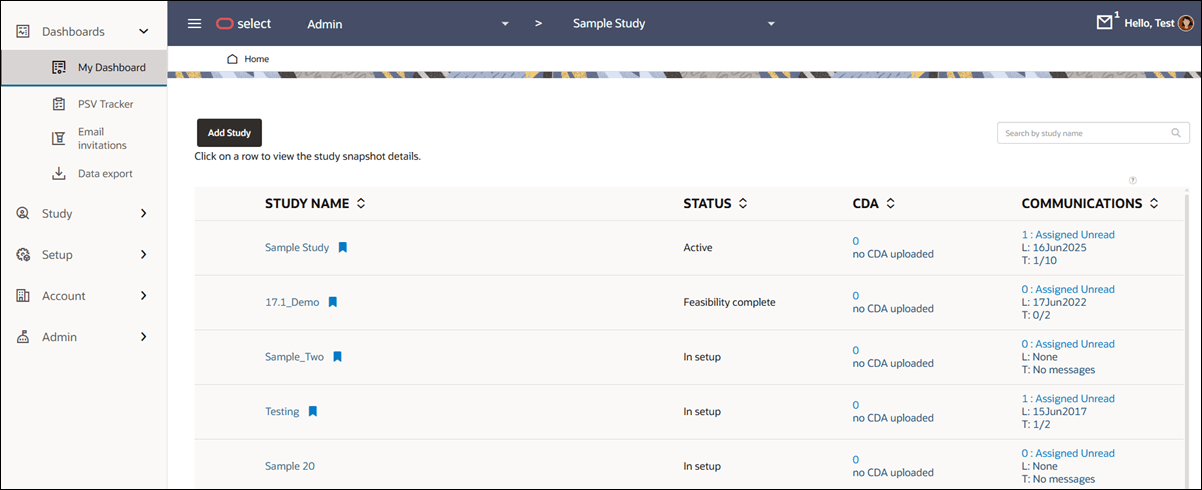
Your My Dashboard page is specific to your study assignments. It includes a study grid with quick views into the progress of sites in the study and insight into study communications and pending CDAs. Click any linked study name to navigate to that study's home page. You can interact with that study as usual and favorite the study if preferred. Your favorite studies sort to the top of the study grid (alphabetically among any other favorite studies).
Your user account permissions also affect the display of other menu or action items on your My Dashboard page. For example:
- If you have an account administrator permission (such as user management), you can see the global "account" menu, and the menu has all items you have permission to use.
- When you have Account study creation permission, you'll see an Add Study action button above the study list. Just enter a unique study name and ID to create the study within the account, and you'll see a confirmation when successful. After creation, the new study's home page displays and includes a "Manage study details" task link to provide quick access to the first step in new study setup.
Additionally, you can control which studies display based on Status. For instance, you can choose to display only those studies in Active or In setup status and filter out all others. You'll set this option in your "my profile" page (click the circular avatar at the upper left of any page) using the Filter study list control. Please note that this setting will also affect the studies returned in the page header's study picker.

A sortable CDA column shows the count of actionable CDAs (those in Requires review or Final review status) and the date of the last CDA uploaded for a site assigned to you. The CDA column design brings higher visibility to these documents, as they can be challenging to track as they progress from submission to approval.
Check the Communications column to see if unread messages might need to be addressed. This column reflects multiple totals, and the stacked numbers are:
number = the total unread communications from sites assigned to you for the study
L = Date last message received from a site in the study
T = Total unread messages from sites in the study / Total messages received from sites in the study.
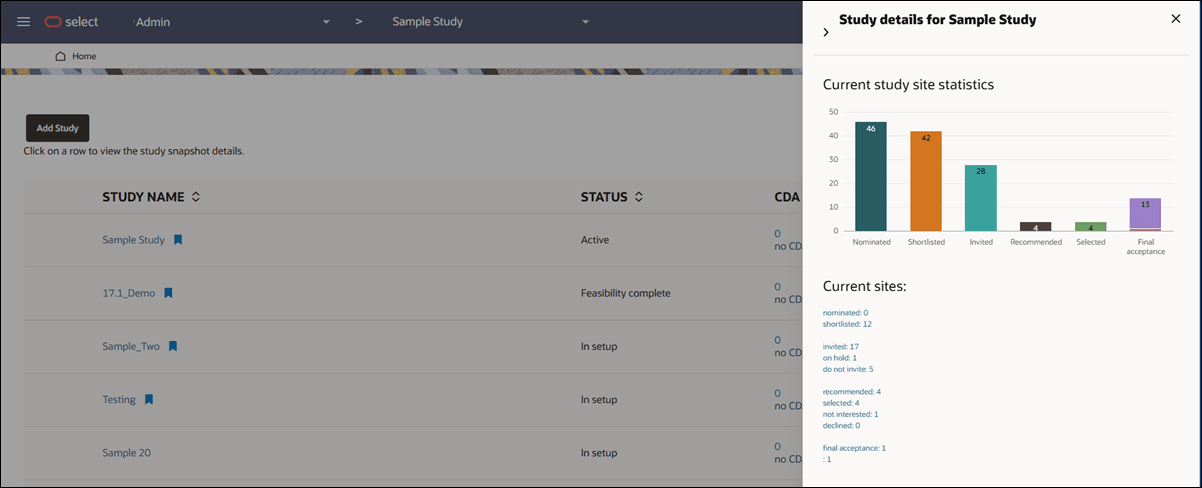
My Dashboard also includes a study details drawer component that opens from the right side of the page when you click on a study row. From top to bottom, the drawer displays:
- Study details, which is an expandable accordion list of values saved on the Study details page. This section can display:
- Study ID
- Protocol number
- Study type
- Study sponsor
- Study internal description
- Study internal ID
- Study internal status
- Study owner
- Study partner ID
- Study site statistics (the same progress visualization you see on that study's home page)
- Current site counts by bucket state. Click to navigate directly to any listed bucket state.

Parent topic: Dashboards