1 Getting Started
This chapter provides an overview of Oracle Retail AI Foundation Cloud Services.
About Oracle Retail AI Foundation Cloud Services
The Oracle Retail AI Foundation Cloud Services is an analytical product that consists of the following modules: Customer Decision Tree Science Cloud Service, Demand Transference Science Cloud Service, Advanced Clustering Cloud Service, Customer Segmentation, Lifecycle Pricing Optimization Cloud Service, and Assortment and Space Optimization Cloud Service. You may have access to all of these modules or to a subset of them.
Administration
For information about the administration of Oracle Retail AI Foundation Cloud Services, see Oracle Retail AI Foundation Cloud Services Administration Guide.
Oracle Retail AI Foundation Dashboard
The dashboard provides access to all Oracle Retail AI Foundation modules. The main tasks associated with each module are listed in the panel on the left, as shown in the following figure. Each module has its own tab.
Figure 1-1 Oracle Retail AI Foundation Tasks
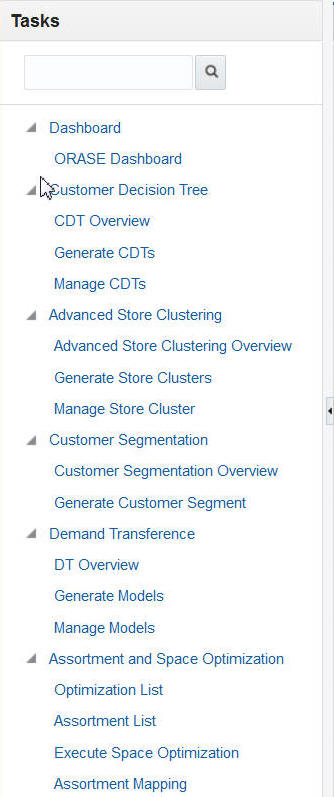
Description of "Figure 1-1 Oracle Retail AI Foundation Tasks"
Process
This guide contains a chapter for each of the modules with detailed instructions. In general, each module contains a set of tabs, including an overview tab and tabs to use the module functionality.
Customer Decision Tree
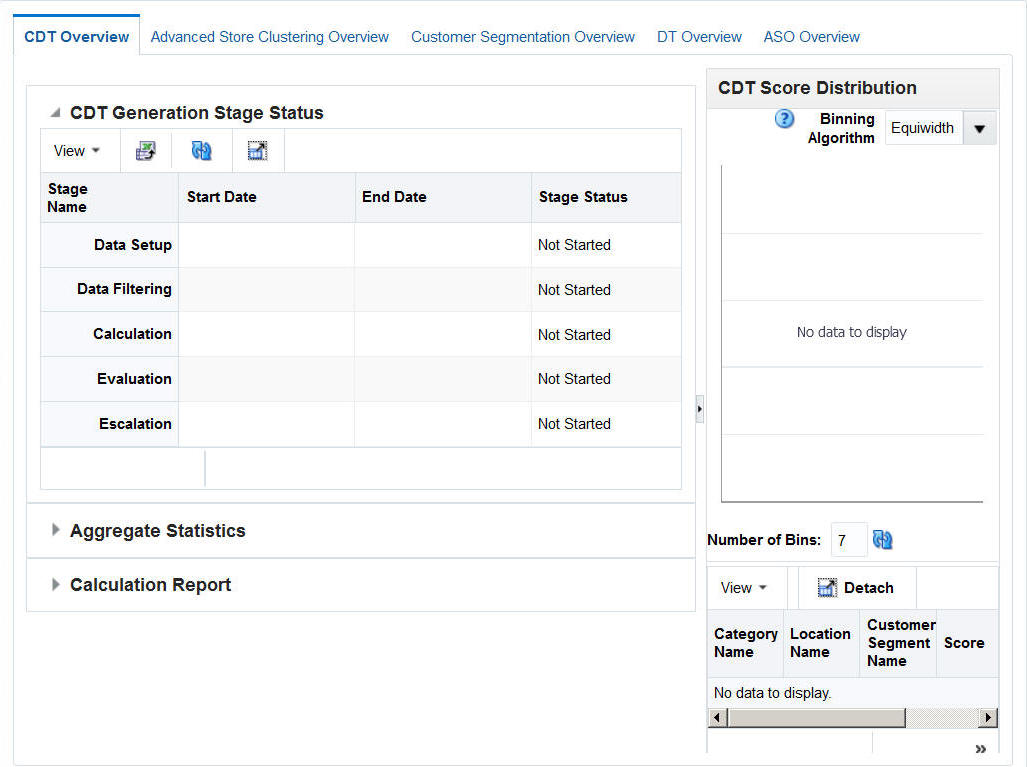
The Customer Decision Tree Overview tab is shown in following figure.
When you use the CDT Cloud Service module, you follow this general iterative process to create and manage CDTs:
-
Setup. You define the domain of calculation by selecting the categories and time frame for the calculation of the CDTs.
-
Data Filtering. You configure filters that remove input data that might cause errors in the calculation or that might lead to inaccurate or unreliable answers.
-
Calculation. You calculate a specific version of a CDT. Different versions of the CDT based on different configurations can be calculated and compared.
-
Evaluation. You examine the results of the calculation and determine the reliability and accuracy of the answers. You can prune inaccurate or unreliable results.
-
Escalation. When you are satisfied with the results, you can set the escalation path to fill in the holes for partitions whose CDTs were removed during pruning by setting up a search path through the segment hierarchy and the location hierarchy. Then, you can set a version of a CDT as complete.
Within each stage, you set the required parameters. In some stages, once you do that you click Run to initiate the process. To determine when a run is complete, go to the Overview tab and click the Refresh icon in order to see the current status of each stage. If you make changes to a stage, you must re-run that stage and all the relevant stages that follow it as the results of those stages are made invalid by the changes you made.
Demand Transference
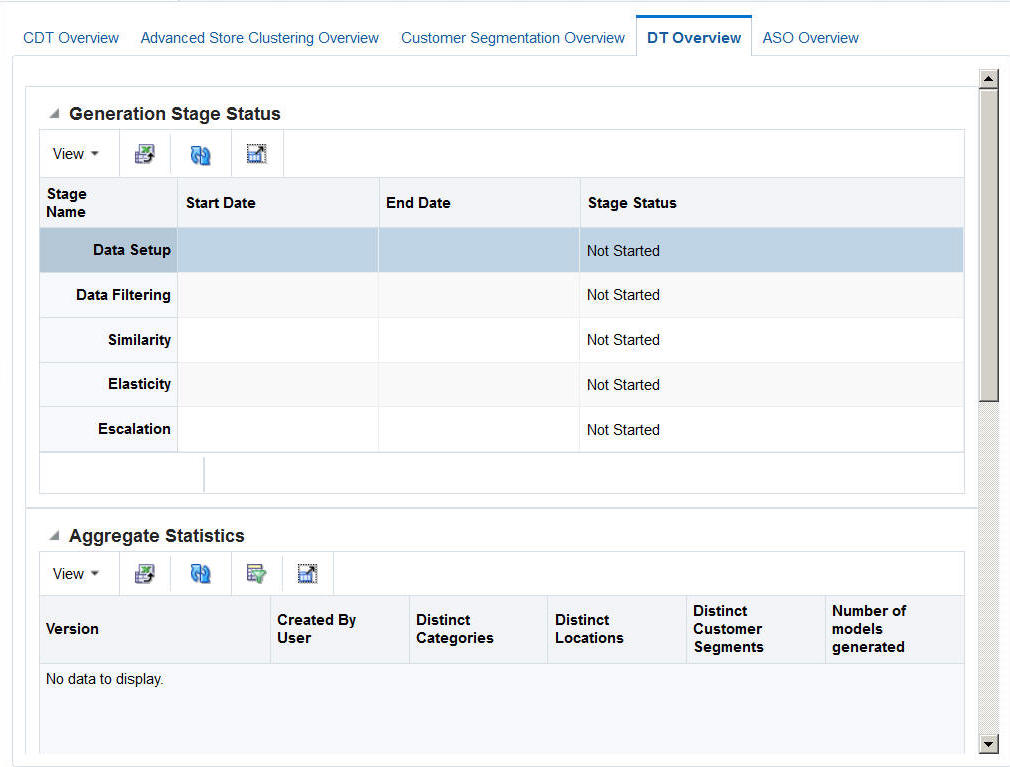
The Demand Transference Overview tab is shown in the following figure..
When you use the DT Cloud Service module, you follow this general iterative process to create and manage DT models:
-
Data Setup. You define the categories to be used in the DT calculation.
-
Data Filtering. You configure filters that remove input data that might cause errors in the calculation or that might lead to inaccurate or unreliable results.
-
Similarity Calculation. You calculate similarities and assess the results of the calculation.
-
Elasticity Calculation. You calculate the assortment elasticities and assess the results in terms of substitutable demand, which is the percentage of demand of a SKU that is retained when the SKU is deleted from the stores where it is selling.
-
Escalation. When you are satisfied with your results, you can set the escalation path to fill in the holes for partitions whose DT models were removed during pruning by setting up a search path through the segment hierarchy and the location hierarchy. Then you can set a version of the DT model as complete.
-
Manage Models. Use this tab to set time intervals for evaluating your results and to override the value for the maximum substitutable demand percentage.
Advanced Clustering
The Advanced Clustering Overview tab is shown in the following figure.
Figure 1-4 Advanced Clustering Overview Tab
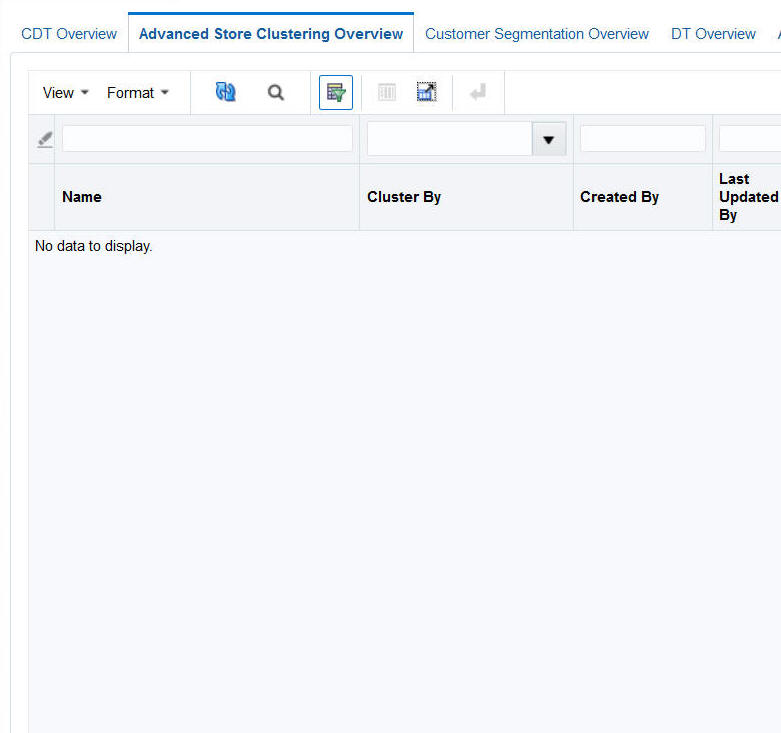
Description of "Figure 1-4 Advanced Clustering Overview Tab"
To use Advanced Clustering, follow this general process to create and manage clusters, working in the Generate Store Clusters tab and the Manage Store Clusters tab:
-
Cluster Criteria. View all available clusters for specified merchandise, location, and calendar. Review cluster criteria or scenario details for each cluster. Use an existing cluster as the basis for creating a new cluster.
-
Explore Data. Examine the input data for the cluster. Review multiple data points and significant attributes using the contextual information.
-
Cluster Setup. Define multiple what-if scenarios. Such scenarios can be compared with one another throughout the clustering process.
-
Cluster Results. View the scenario results and compare scenarios.
-
Cluster Insights. Gain an understanding about cluster results and cluster performance prior to approval by examining the contextual information.
-
Manage Store Clusters. Manage existing cluster criteria. Perform manual overrides and approve clusters.
Customer Segmentation
The Customer Segmentation Overview tab is shown in the following figure.
Figure 1-5 Customer Segmentation Overview Tab
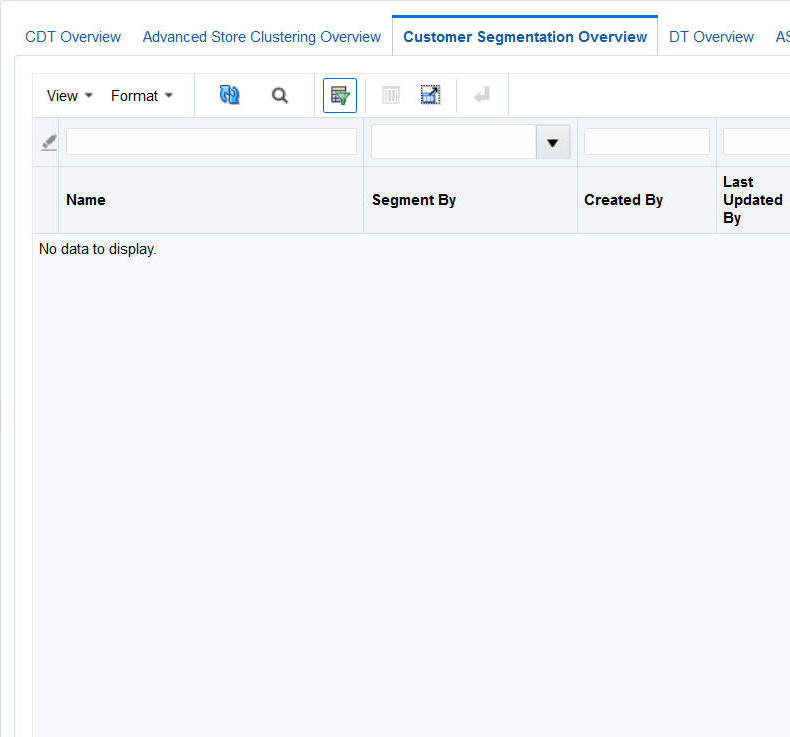
Description of "Figure 1-5 Customer Segmentation Overview Tab"
To use Customer Segmentation, follow this general process to create segments, working in the Generate Customer Segment tab:
-
Segment Criteria – View all available segments for the specified merchandise, location, and calendar. Review the segment criteria or scenario details for each segment. Use an existing segment as the basis for creating a new segment.
-
Explore Data – Examine attributes and their summaries for the segment. Review multiple significant attributes and their correlations using the contextual information.
-
Segment Setup – Define multiple what-if scenarios. Such scenarios can be compared with one another throughout the segmentation process.
-
Segment Results – View the scenario results and compare scenarios.
-
Segment Insights – Gain an understanding of segment results and segment performance prior to approval by examining the contextual information.
Assortment and Space Optimization
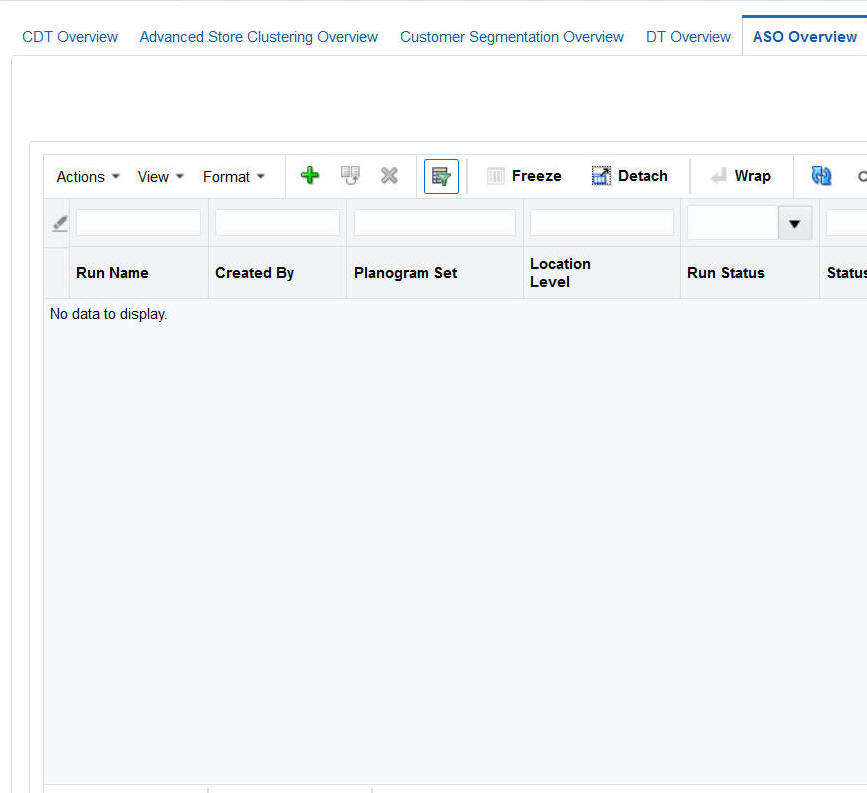
The Assortment and Space Optimization Overview tab is shown in the following figure.
ASO is used to optimize a category manager's assortment plan by creating optimal planograms. The category manager creates a preliminary assortment and wants to determine how well that list of products can fit in stores, given the available space, product sizes, and merchandising goals, constraints, and rules. The application creates virtual planograms that organize products onto fixtures in a way that best achieves the optimization objectives. Once the manager finalizes the optimization results, the product level data can be exported for use in planning applications.
Overview of the User Interface
The user interface includes functionality described in this section.
Process Train
You can use the process train to navigate through the stages of each module. You can also use the Back button and the Next button to move through the train. The color changes for each stage once you visit that stage. Certain stages require you to run that stage before you can go to the next stage.
View Menu
The View Menu provides access to a variety of functionality that you can use to customize the display of the tables in the user interface.
Embedded Help
Embedded help, which you access by clicking the Question Mark icon, provides additional information about the type of details required by certain fields.
Process Indicator
At the top of the user interface, in the right-hand corner, is a process indicator that you can use to monitor the status of a user action such as clicking Next to go to the next stage.
Search
In certain cases, you can customize your search, using advanced search capabilities to specify the search criteria.
Icons
The following icons are used in the user interface.
Table 1-1 Icons Used in the User Interface
| Icon | Icon Name | Icon Description |
|---|---|---|
|
|
Add |
Add a category for CDT or DT. Add a cluster in Advanced Clustering. Create new scenarios in Advanced Clustering. |
|
|
Approve Version |
Approve a version of a CDT. |
|
|
Calculate |
Initiate calculation of substitutable demand percentages in DT. |
|
|
Compare Two CDTs |
Look at two CDTs side-by-side in the CDT Editor. |
|
|
Complete |
Indicates the CDT is ready to be activated. |
|
|
Delete an entry in a table. Delete a scenario in Clustering. |
Delete. |
|
|
Detach |
Detach the table from the user interface for better viewing. |
|
|
Duplicate |
Make a copy of a scenario. |
|
|
Edit |
Edit the category attributes (CDT and DT) |
|
|
Embedded Help |
Indicates that embedded help is available for the adjacent field. |
|
|
Execute |
Execute the scenario. |
|
|
Export to Excel |
Export the selected data to Excel. |
|
|
Go To Top |
Adjusts table display. |
|
|
Go Up |
Adjusts table display. |
|
|
No |
Indicates No in Advanced Clustering. |
|
|
Query By Example |
Provides access to a text entry field at the top of each column that you can use to search for data by an initial set of characters. |
|
|
Refresh |
Update the table display or the stage status. |
|
|
Revert |
Reverts the DT calculation. |
|
|
Save |
Save the scenario. |
|
|
See Similarities |
See similarities in DT Similarities Display. |
|
|
Set Version As Complete |
Set a CDT version as complete. |
|
|
Select Date |
Access a calendar in order to select a specific date. |
|
|
Show As Top |
Adjusts table display. |
|
|
View One CDT |
Access a CDT in the CDT Editor. |
|
|
Withdraw From Approved Version |
Un-approve a version of a CDT. |
|
|
Yes |
Acts as an indication that something exists in Advanced Clustering. |
Buttons
Buttons are used for navigation and to perform certain actions.
Table 1-2 Buttons
| Name | Description |
|---|---|
|
Action |
Provides access to Save, Approve, and Reject. |
|
Advanced |
Provides access to advanced search functionality. |
|
Approve |
Used to approve a CDT or a cluster. |
|
Back |
Used to navigate the process train. |
|
Cancel |
Cancels the action. |
|
Complete |
Used to make a CDT or DT model active. |
|
Next |
Moves to the next stage. |
|
Reject |
Used to navigate the process train. |
|
Reset |
Resets the values to the original ones. |
|
Run |
Initiates a run. |
|
Search |
Provides access to search functionality. |
|
Stop |
Stops a process. |
Browser Settings
The supported browsers include Mozilla Firefox 68+ ESR, Google Chrome (Desktop) 79+, and Microsoft Edge 44+.
Concurrent Browser Sessions
Users should not log into more than one browser session at the same time using the same user name.
Localization
The default language for the application is English. If you are using a different language on your computer, you should adjust the language settings on your browser as appropriate.
Supported Characters for Text Entry
The following characters are valid for text input: all letters, all numbers, and the following characters: '_', '#', '%', '*', '$', ' ', ',' & '-'
Histograms
Certain stages have associated histograms that can help you analyze the data presented in that stage. You can adjust the way the histogram presents the data in two ways. You can select the number of bins that are used to display the data. In addition, you can select how the bins are defined: Equiwidth or Custom. Each of these options uses a specific algorithm to determine how the bins are defined.
The Equiwidth approach takes the minimum and maximum values in a set of numbers and divides that range into equally sized bins. For example, using the numbers from 1 to 100 with 10 bins, the histogram shows bins for 1-10, 11-20, and so on. If specific bins have no value represented (for example, if all the values are in the range of 1-10 and 91-100), then the histogram will not show that bin in the UI. Additionally, the histogram data series ranges are shown using the actual minimum and maximum values for each of the bins. So rather than showing a range of 1-10, if the only value available was a 5, then the range for the first bin would appear as 5-5. In the Custom approach, each of the bins has an equal number of values represented, while the minimum and maximum number associated with the bin is adjusted. However, the bins are defined using distinct values instead of all the available values. The bins may or may not be of equal height, depending on how diverse the numbers are.
The two approaches differ in that the Custom approach only shows fewer bins than requested if there are fewer distinct values than what was requested for the number of bins.
The two approaches are similar in that both handle the Min/Max value display in a similar manner, using actual data values that are associated with the bin.
To determine which approach to use, you should consider what type of data you are trying to see and the amount of detail you want. For example, if you are trying to set a data filter value, and you want to do so using a common value, you may be able to see where most of the data falls using one of the algorithms, while the other algorithm may help you pinpoint a specific value within the range. The Equiwidth approach is negatively affected by values that are at the extreme ends of a value being binned. This can cause the majority of the data values to appear in a single bin. The Custom approach puts a greater emphasis on a value that is repeatedly found in a dataset. Depending on the values being charted, you may find that one of the approaches presents better data than the other approach.
