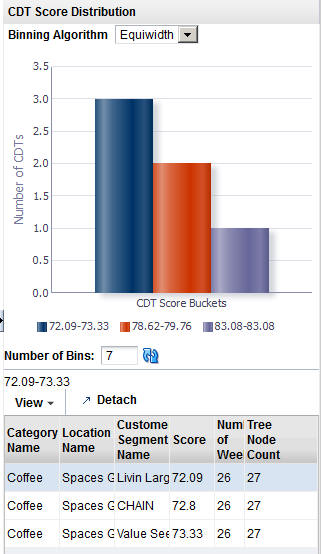
14 CDT Score Distribution Histogram
The CDT Score Distribution histogram displays, for the current calculation and the current user, the range of CDT scores and their frequencies. CDT scores range from 0 to 100; a higher number indicates a better score. You can use the information in this histogram to assess the quality of your CDTs.
For detailed information about using the histograms, see Getting Started..
Below the histogram you see a table that provides details about the histogram. This information can help you assess the quality of a CDT. Click on a specific bin in the histogram to populate the table with information about that bin. You see a list of all the specific partitions for the bin, along with the score for each, the number of weeks of data used to calculate the score, and the number of tree nodes for each partition for the selected bin.
Table 14-1 CDT Score Distribution Fields
| Field Name | Description |
|---|---|
|
Category Name |
The category name of the partition for the specific CDT score. |
|
Location Name |
The location name of the partition for the specific CDT score. |
|
Customer Segment Name |
The customer segment name of the partition for the specific CDT score. |
|
Score |
The CDT score for the defined partition. A CDT score ranges from 0 to 100. A higher value indicates a better score. |
|
Number of Weeks |
The number of weeks of data used to calculate the CDT score. |
|
Tree Node Count |
The number of tree nodes present in the CDT tree structure used to calculate the CDT score. |
