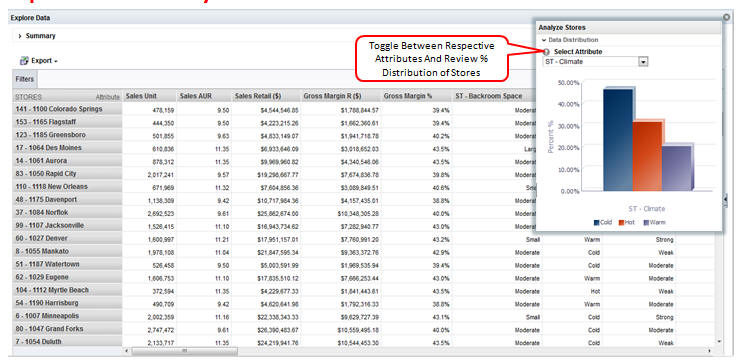
Analyze Stores
In Explore Data, the BI displays the data distribution of the location by each participating attribute as well as other configured informational attributes. Advanced Clustering identifies the bins based on the underlying data and displays the histograms. It provides the percentage of stores that are present in a location. For example, a company may have 45 percent of stores in cold regions.
