Assortment Recommender
The assortment recommender screen provides insights on ways to improve the mix of products in a store assortment, using a combination of data from Demand Transference and Affinity Analysis. This section describes the data shown in the screen, as well as how to use the results to take action within your business. For more information on Demand Transference, refer to Demand Transference.
The first step in using the assortment recommender screen is to select a store and assortment to review. The stores listed in the drop-down menu are limited to those stores that have completed an assortment recommendation calculation for the selected department in the selected period. The assortment drop-down menu is limited to those assortments with a completed assortment recommendation calculation for the date range, department, and location previously selected, and align with the level of the product hierarchy that assortment-planning operations occur at. For example, if we process Coffee on Week 1, Yogurt on Week 2, and Milk on Week 3, and we pick a date range of Weeks 1-3 in the global prompts, we will show results for those three categories.
After selecting a store and an assortment, the screen displays data showing the system-optimized product list and the original product list, along with several summary metrics.
Table 7-5 Assortment Optimization Summary Metrics
| Field Name | Description |
|---|---|
|
SKUs Added |
The number of SKUs added to the assortment by the optimization process. |
|
SKUs Dropped |
The number of SKUs removed from the assortment by the optimization process. |
|
Amount % Variance |
The change in sales retail amount for the assortment after SKUs are added and dropped by the optimization, based on average weekly sales. |
|
Units % Variance |
The change in sales units for the assortment after SKUs are added and dropped by the optimization, based on average weekly sales. |
The following table lists the summary metrics that the optimized assortment table displays insights into expected product performance if the recommendations are applied to your assortment.
Table 7-6 Optimized Assortment Table
| Field Name | Description |
|---|---|
|
Item |
The item number and description of the SKU in the assortment. |
|
Description |
The recommended change for a SKU in the assortment. This may either be to keep an existing SKU or add a SKU that was not previously in the assortment. |
|
Base Sales Units |
The average weekly sales units of the SKU at the selected location. |
|
Halo Sales Units |
The average weekly sales units of the SKU at the selected location, after adjusting for demand as a result of Halo sales due to market basket affinity rules involving the SKU. |
|
Base Sales Amount |
The average weekly sales amount of the SKU at the selected location. |
|
Halo Sales Amount |
The average weekly sales amount of the SKU at the selected location, after adjusting for demand as a result of Halo sales due to market basket affinity rules involving the SKU. |
|
Base Sales Profit Amount |
The average weekly sales profit of the SKU at the selected location. |
|
Halo Sales Profit Amount |
The average weekly sales profit of the SKU at the selected location, after adjusting for demand as a result of Halo sales due to market basket affinity rules involving the SKU. |
|
Incremental Demand |
The number of sales units of the SKU that do not transfer to any other SKU in the assortment if it were to be deleted from the assortment. |
|
Substitutable Demand |
The number of sales units of the SKU that can transfer to other SKUs in the assortment if it were to be deleted from the assortment. |
The primary purpose of the recommendations is to highlight the optimal mix of products, based on a pre-defined optimization target (which can be sales units, amount, or profit). The optimization process takes into account the product similarities and assortment elasticity (as generated by Demand Transference) to determine which products are candidates for addition or removal from the current assortment. It also uses the market basket affinity rules to identify additional sales generated by the SKUs in the assortment in other product categories. For example, a SKU that belongs to Subclass A, which has a strong affinity with sales of Subclass B, is effectively generating a certain number of additional sales outside of the assortment itself just by being included.
This combination of inputs into the optimization process may result in SKUs being added or dropped from the assortment. A SKU that has been dropped from the assortment may have been found to be too similar to other existing SKUs (thus its removal will transfer the majority of the demand for that SKU to other similar items). A dropped SKU may also have had a low contribution to sales in that assortment, either due to a lack of affinity rules generating additional halo effects, or because other SKUs available for addition provided better results and were swapped in. The system may recommend product additions when it has identified SKUs that will improve the optimization target, such as sales profit. It may also recommend adding a SKU when there are no similar SKUs currently in the assortment, so adding the new SKU will not cannibalize much demand from other items.
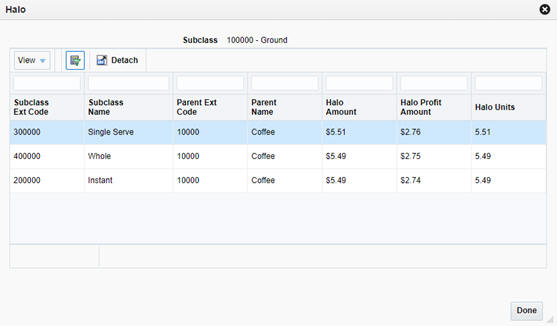
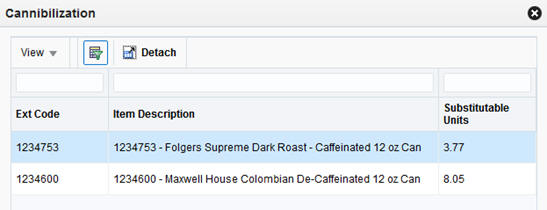
If you want to analyze the recommendations further, the system provides pop-up windows displaying Halo and Cannibalization effects relating to the selected item from the Optimized Assortment table. Select a row in the table, and then click the Halo or Cannibalization buttons on the task bar to review the data.
Table 7-7 Halo Effects
| Field Name | Description |
|---|---|
|
Subclass Ext Code |
The numeric identifier for a subclass with a halo effect from the SKU. |
|
Subclass Name |
The descriptive name for a subclass with a halo effect from the SKU. |
|
Parent Ext Code |
The numeric identifier of the parent class for a subclass. |
|
Parent Name |
The descriptive name for the parent class for a subclass. |
|
Halo Amount |
The calculated halo effect on the subclass's sales amount. |
|
Halo Profit Amount |
The calculated halo effect on the subclass's sales profit. |
|
Halo Units |
The calculated halo effect on the subclass's sales units. |
The Halo pop-up window provides insights into the secondary effect of a SKU on other products. Products with strong market basket affinities may generate large halo effects and thus be good candidates for your assortment.
When evaluating the additions and removals on your assortment, it can also be helpful to understand cannibalization effects. These effects are based on the product similarities and assortment elasticities obtained from Demand Transference. Products that are very similar to each other tend to split up the customer demand for this kind of product, since the customer is not likely to buy two similar products. Conversely, products that are not very similar will not have as much overlapping demand. The Cannibalization pop-up window provides some of these insights.
Table 7-8 Cannibalization Effects
| Field Name | Description |
|---|---|
|
Ext Code |
The numeric identifier for a SKU that is cannibalized by the selected assortment SKU. |
|
Item Description |
The descriptive value for the SKU. |
|
Substitutable Units |
The calculated number of sales units that can be cannibalized from other SKUs when the assortment SKU is added, or the number of units transferred to these SKUs when the assortment SKU is dropped. |
At the bottom of the screen, you can also see the original assortment, along with any SKUs from the assortment that have been dropped in the recommendation.
Table 7-9 Original Assortment
| Field Name | Description |
|---|---|
|
Item |
The item number and description of the SKU in the assortment. |
|
Description |
The recommended change for a SKU in the assortment. This may either be to keep an existing SKU or drop a SKU that was in the assortment. |
|
Base Sales Units |
The average weekly sales units of the SKU at the selected location. |
|
Halo Sales Units |
The average weekly sales units of the SKU at the selected location, after adjusting for demand as a result of Halo sales due to market basket affinity rules involving the SKU. |
|
Base Sales Amount |
The average weekly sales amount of the SKU at the selected location. |
|
Halo Sales Amount |
The average weekly sales amount of the SKU at the selected location, after adjusting for demand as a result of Halo sales due to market basket affinity rules involving the SKU. |
|
Base Sales Profit Amount |
The average weekly sales profit of the SKU at the selected location. |
|
Halo Sales Profit Amount |
The average weekly sales profit of the SKU at the selected location, after adjusting for demand as a result of Halo sales due to market basket affinity rules involving the SKU. |


